Categories: Technical analysis

GBPCAD Wave Analysis – 22 October, 2021

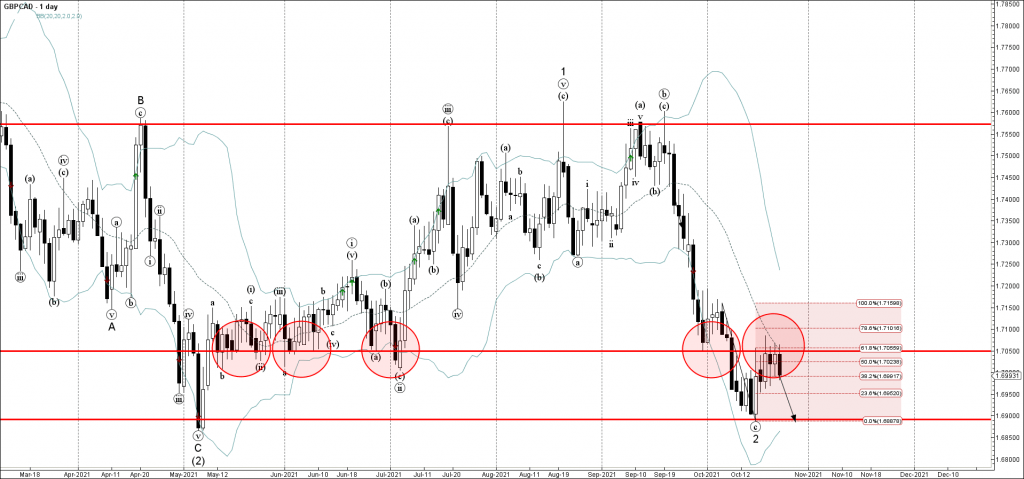
• GBPCAD reversed from resistance zone

• Likely to fall to support level 1.6900                                                                     


GBPCAD recently reversed down from the resistance zone lying between the major resistance level 1.7050 (former long-term support from May) and the 61.8% Fibonacci correction of the downward impulse from the start of October.

The downward reversal from this resistance zone stopped the earlier short-term impulse wave 3.

Given the strong bearish sterling sentiment, GBPCAD can be expected to fall further toward the next support level 1.6900 (low of the previous correction 2).

The FxPro Tech Analysis Team

The FxPro technical experts prepare a daily analysis of the most active currency pairs (majors, crosses, exotics) and commodities. Selected instruments are reviewed on daily trends (D1, H4), using the active Elliott Wave setups, Japanese candlesticks, indicators, and support/resistance levels.

Share
Published by
The FxPro Tech Analysis Team
Tags: GBPCAD

Recent Posts

Ebay Wave Analysis 30 April 2024

- Ebay under the bearish pressure - Likely to fall to support level 51.00 Ebay…

4 hours ago

GBPAUD Wave Analysis 30 April 2024

- GBPAUD reversed from key support level 1.9135 - Likely to rise to resistance level…

4 hours ago

Silver: a possible long road down

Silver has lost 2.6% since the start of the day on Tuesday to $26.4 per…

7 hours ago

Another Dip in Crypto Capitalization

Market picture  The crypto market capitalisation decreased by another 1.5% to $2.27 trillion, getting closer…

11 hours ago

ANF Wave Analysis 29 April 2024

ANF reversed from key support level 113.40 Likely to rise to resistance level 132.31 ANF…

1 day ago

GBPUSD Wave Analysis 29 April 2024

- GBPUSD rising inside minor correction 2 - Likely to rise to resistance level 1.2700…

1 day ago

This website uses cookies