Categories: Technical analysis

GBPCAD Wave Analysis 19 November, 2020

• GBPCAD reversed from resistance level 1.7350

• Likely to fall to 1.7200

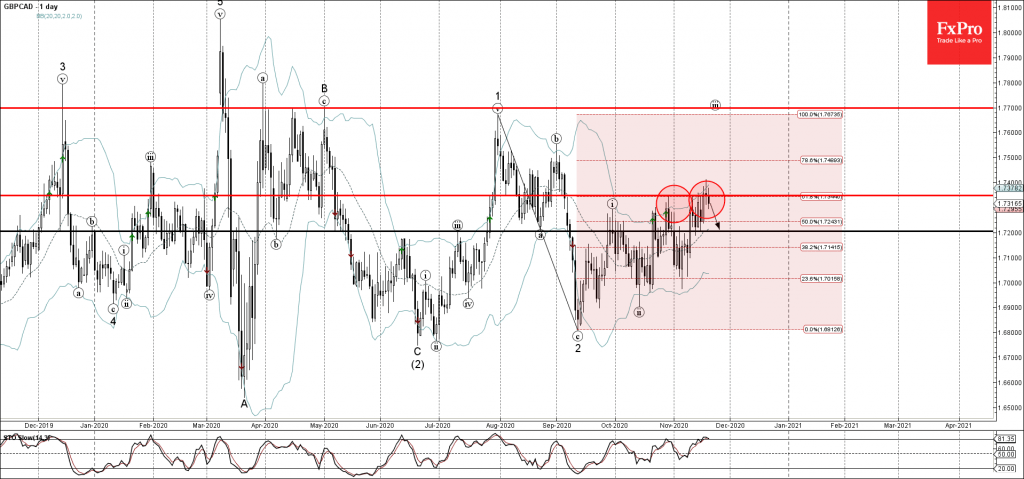
GBPCAD recently reversed down from the resistance level 1.7350 (former monthly high from October) – intersecting with the upper daily Bollinger Band and the 61.8% Fibonacci correction of the previous downward ABC wave 2 from July .

The downward reversal from the resistance level 1.7350 stopped the previous short-term impulse wave (iii) from October.

With the overbought daily Stochastic – GBPCAD is likely to fall further toward the next support level 1.7200 (which has been reversing the price from the start of November).

The FxPro Tech Analysis Team

The FxPro technical experts prepare a daily analysis of the most active currency pairs (majors, crosses, exotics) and commodities. Selected instruments are reviewed on daily trends (D1, H4), using the active Elliott Wave setups, Japanese candlesticks, indicators, and support/resistance levels.

Share
Published by
The FxPro Tech Analysis Team
Tags: GBPCAD

Recent Posts

Crypto Market Retreats Due to Overhang of Sellers

Market picture The crypto market has lost 3.3% in the last 24 hours to $2.3…

48 mins ago

USDJPY Wave Analysis 26 April 2024

- USDJPY broke key resistance level 155.00 - Likely to rise to resistance level 160.00…

3 days ago

Ebay Wave Analysis 26 April 2024

- Ebay reversed from support level 49.35 - Likely to rise to resistance level 52.55…

3 days ago

False Alert with Yen Interventions?

Even though the Bank of Japan left the key rate and parameters of the QE…

3 days ago

Cooler Bitcoin

Market picture  Market Dynamics: The cryptocurrency market stabilised, losing just 0.1% of capitalisation and dropping to…

3 days ago

GBPCAD Wave Analysis 25 April 2024

- GBPCAD reversed from key support level 1.6910 - Likely to rise to resistance level…

4 days ago

This website uses cookies