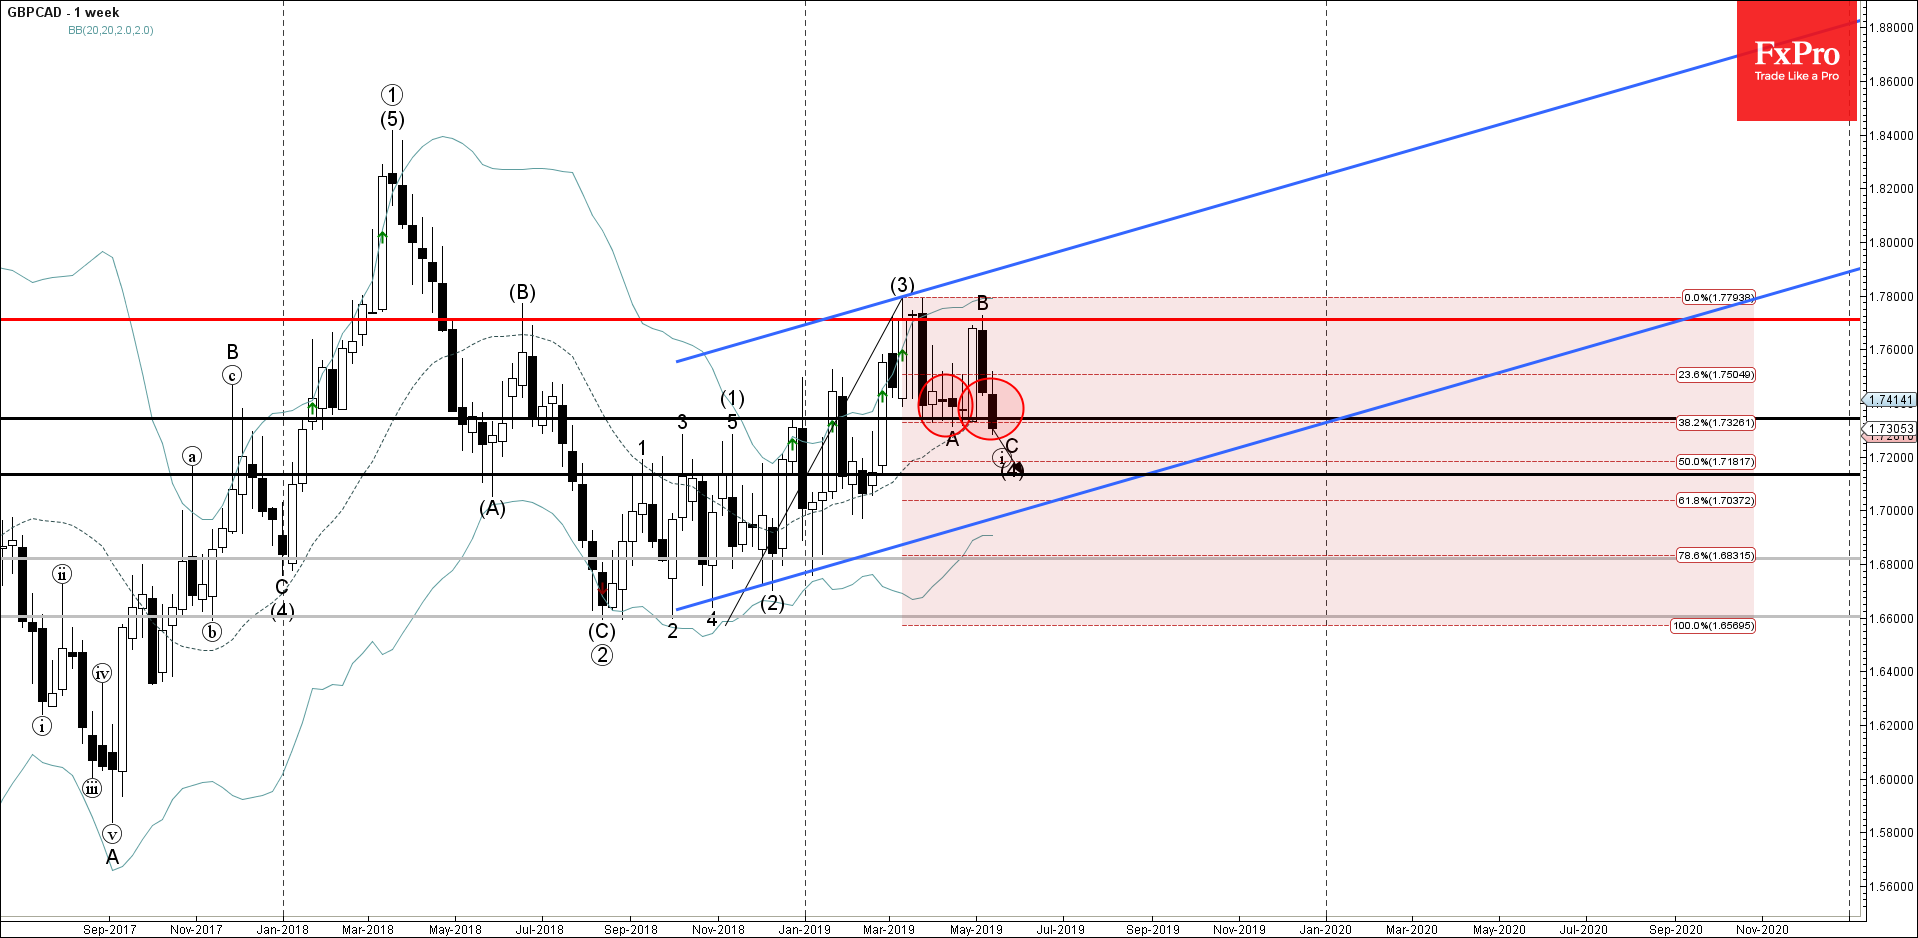
GBPCAD recently broke the support area lying between the pivotal support level 1.7340 (which has been reversing the price in the last few weeks) and the 38.2% Fibonacci correction of the previous upward impulse from last November.
The breakout of this support area should accelerate the active impulse wave C of the ABC correction (4) from March.
GBPCAD is expected to fall further and retest the next support level 1.7140 (target price for the completion of the active correction (4)).
- Adobe reversed from support zone - Likely to rise to resistance level 500.00 Adobe…
- EURJPY reversed from support zone - Likely to rise to resistance level 0.8625 EURGBP…
USDJPY was slipping below 153 on Friday morning, a three-week low and having lost over…
Market picture Crypto market capitalisation rose 3.3% in 24 hours to $2.22 trillion. Local capitalisation…
- EURJPY under strong bearish pressure - Likely to fall to support level 163.10 EURJPY…
- WTI broke round support level 80.00 - Likely to fall to support level 76.00…
This website uses cookies