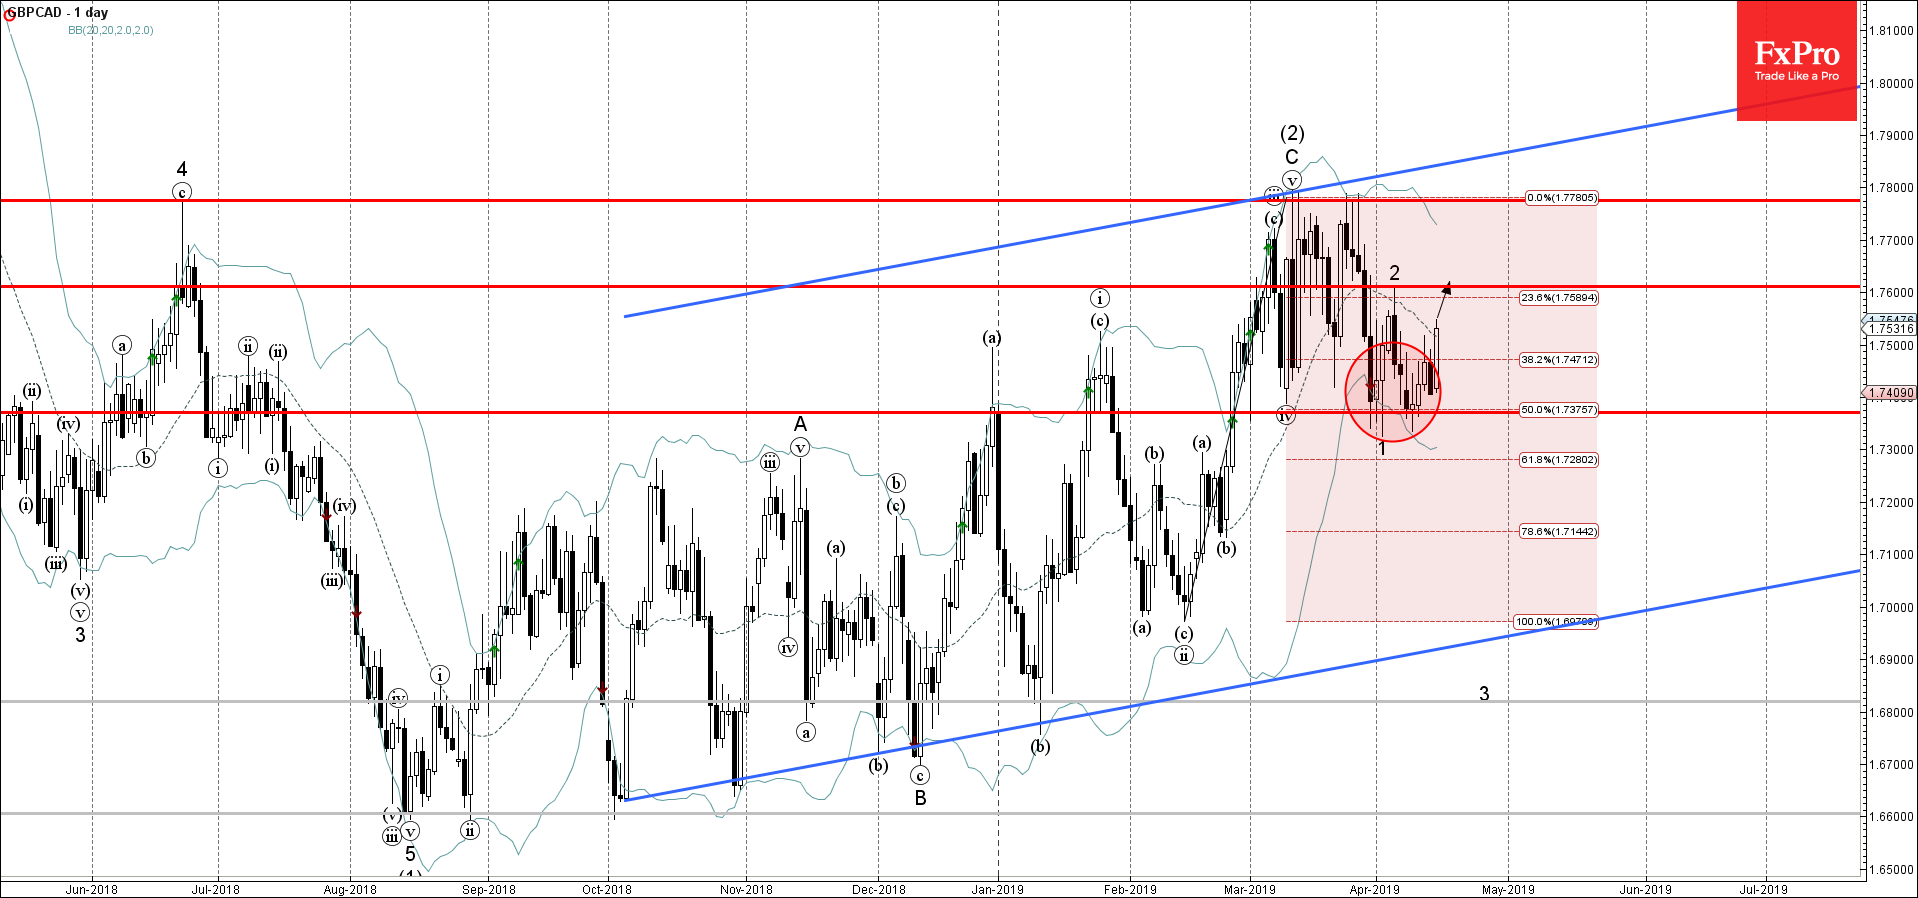
GBPCAD recently reversed up with the two consecutive daily Morning Stars from the support area lying between the key support level 1.7370 (which has been reversing the price from February), lower daily Bollinger Band and the 50% Fibonacci correction of the previous upward impulse from February.
The upward reversal from this support area stopped the earlier short-term downward impulse wave 3.
GBPCAD is expected to rise further and re-test the next resistance level 1.7600 (top of the previous correction 2).
- WTI crude oil reversed from support area - Likely to rise to resistance level…
- AUDJPY reversed from support area - Likely to rise to resistance level 103.00 AUDJPY…
German industrial production continues to decline. The rate of contraction in March was slightly better…
US indices have been gaining daily since the beginning of May. They have found strength…
Market picture The crypto market has lost 2% of its capitalisation over the last 24…
- S&P 500 reversed from support level 5000.00 - Likely to rise to resistance level…
This website uses cookies