Categories: Technical analysis

GBPCAD Wave Analysis – 14 September, 2020

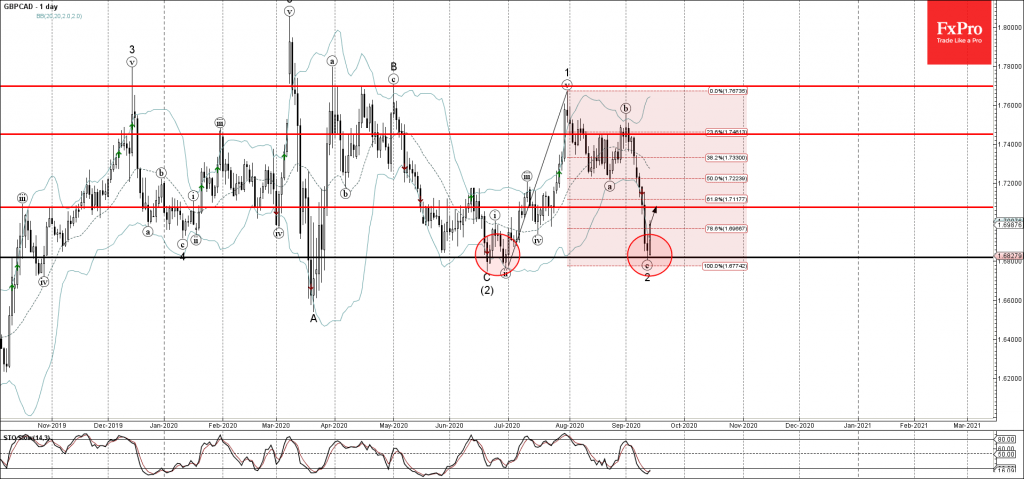
• GBPCAD reversed from multi-month support level 1.6800

• Likely to rise to 1.7075

GBPCAD recently reversed up from the powerful multi-month support level 1.6800 (which also reversed the price twice in June, as can be seen below) – standing near the lower daily Bollinger Band.

The upward reversal from the support level 1.6800 stopped the previous sharp downward ABC correction 2 from the end of July.

Given the oversold reading on the daily Stochastic indicator – GBPCAD is likely to rise further toward the next round resistance level 1.7075.

The FxPro Tech Analysis Team

The FxPro technical experts prepare a daily analysis of the most active currency pairs (majors, crosses, exotics) and commodities. Selected instruments are reviewed on daily trends (D1, H4), using the active Elliott Wave setups, Japanese candlesticks, indicators, and support/resistance levels.

Share
Published by
The FxPro Tech Analysis Team
Tags: GBPCAD

Recent Posts

S&P 500 Wave Analysis 7 May 2024

- S&P 500 reversed from support level 5000.00 - Likely to rise to resistance level…

6 hours ago

USDCHF Wave Analysis 7 May 2024

- USDCHF reversed from support zone - Likely to rise to resistance level 0.9200 USDCHF…

6 hours ago

EURUSD at the equilibrium, where will it go next?

The single currency is trading near $1.076, waiting for further cues and facing serious resistance…

11 hours ago

Bitcoin can’t accelerate but won’t give up trying

Market picture  The crypto market capitalisation fell by 1.7% in 24 hours to $2.29 trillion,…

16 hours ago

USDJPY Wave Analysis 6 May 2024

- USDJPY reversed from support zone - Likely to rise to resistance level 155.65 USDJPY…

1 day ago

Gold Wave Analysis 6 May 2024

- Gold reversed from support zone - Likely to rise to resistance level 2400.00 Gold…

1 day ago

This website uses cookies