Categories: Technical analysis

GBPAUD Wave Analysis – 22 April, 2020

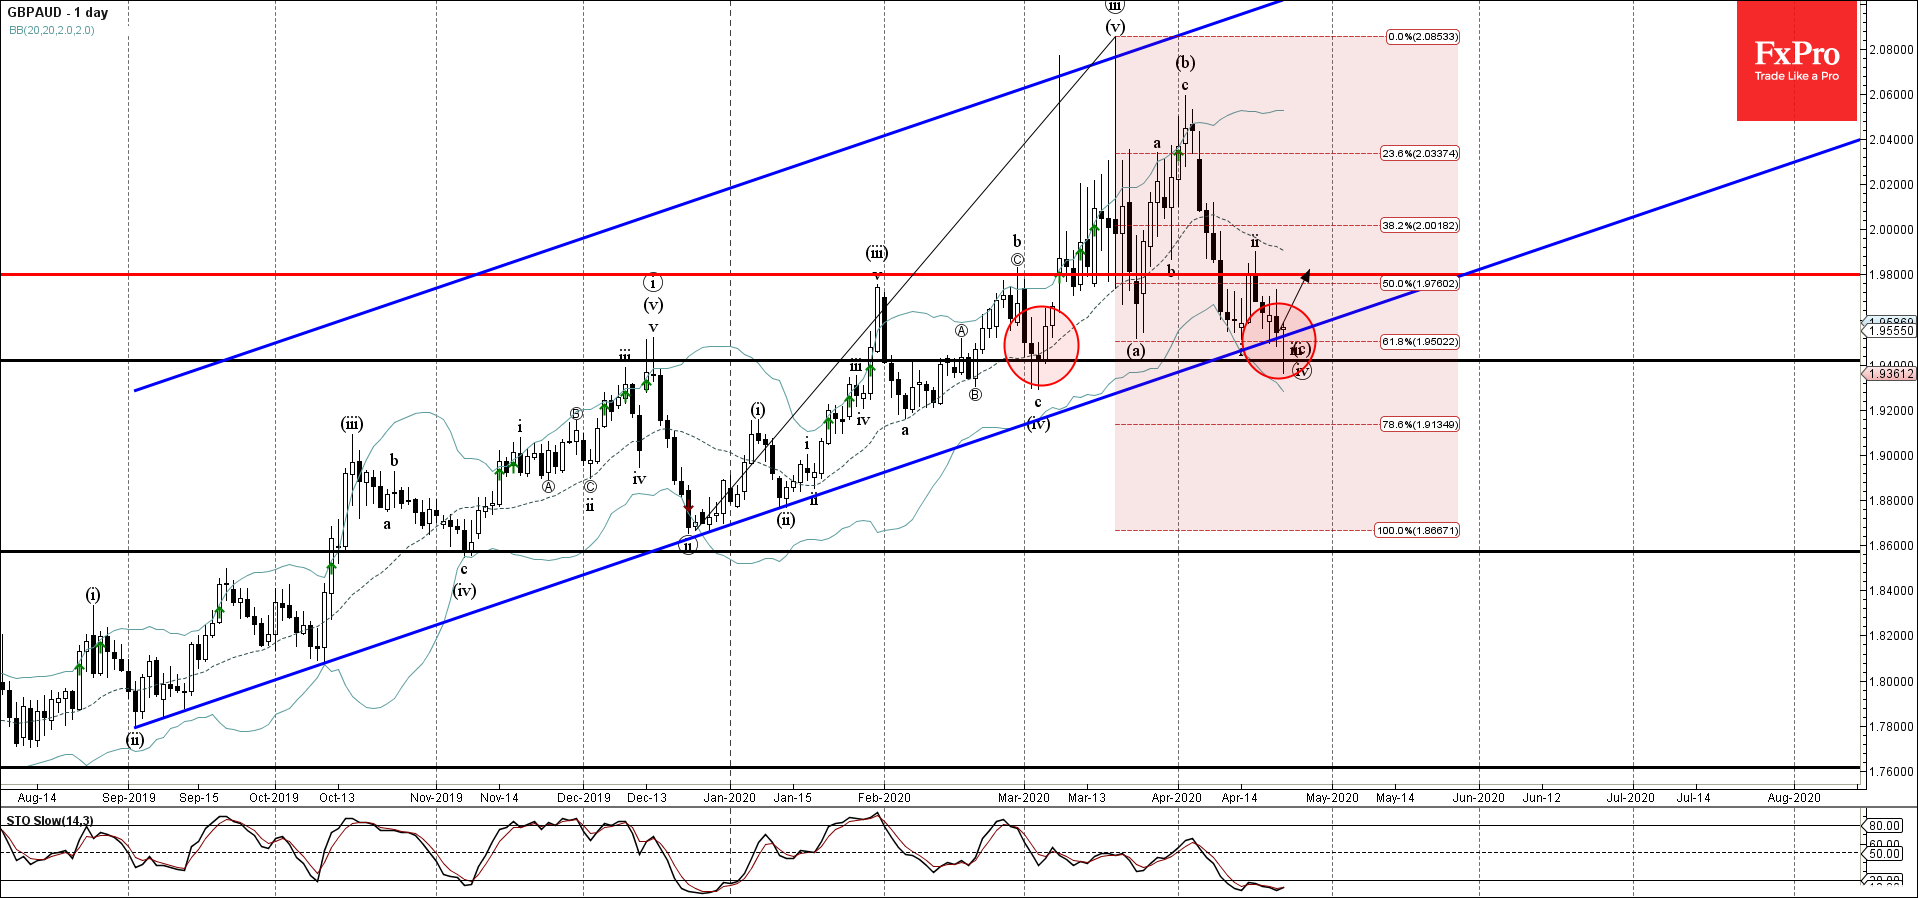
  • GBPAUD reversed from support area
  • Likely to rise to 1.9800

GBPAUD recently reversed up from the support zone lying between the support level 1.9400 (which also reversed the price at the start of March), lower daily Bollinger Band, support trendline of the daily up channel from 2019.

The upward reversal from this support area is likely to create the daily reversal pattern Hammer – if the pair closes today near the active levels.

GBPAUD is expected to rise further toward the next resistance level 1.9800 (which reversed the earlier short-term corrective wave (ii) earlier this month).

The FxPro Tech Analysis Team

The FxPro technical experts prepare a daily analysis of the most active currency pairs (majors, crosses, exotics) and commodities. Selected instruments are reviewed on daily trends (D1, H4), using the active Elliott Wave setups, Japanese candlesticks, indicators, and support/resistance levels.

Share
Published by
The FxPro Tech Analysis Team
Tags: GBPAUD

Recent Posts

Amazon Wave Analysis 16 May 2024

- Amazon reversed from resistance level 190.00 - Likely to fall to support level 180.00…

12 hours ago

USDCHF Wave Analysis 16 May 2024

- USDCHF reversed from round support level 0.9000 - Likely to rise to resistance level…

12 hours ago

Crypto market shakes off consolidation

Market picture The release of US inflation data sparked a surge in risk asset purchases,…

23 hours ago

Gold Wave Analysis – 15 May, 2024

• Gold broke daily down channel • Likely to reach resistance level 2415.00 Gold recently…

2 days ago

AUDUSD Wave Analysis – 15 May, 2024

• AUDUSD broke key resistance level 0.6650 • Likely to reach resistance level 0.6760 AUDUSD…

2 days ago

EURUSD is trying to break the 5-month downtrend

The US dollar has been under relentless pressure since last Thursday, approaching more than one-month…

2 days ago

This website uses cookies