Categories: Technical analysis

GBPAUD Wave Analysis – 21 February, 2019

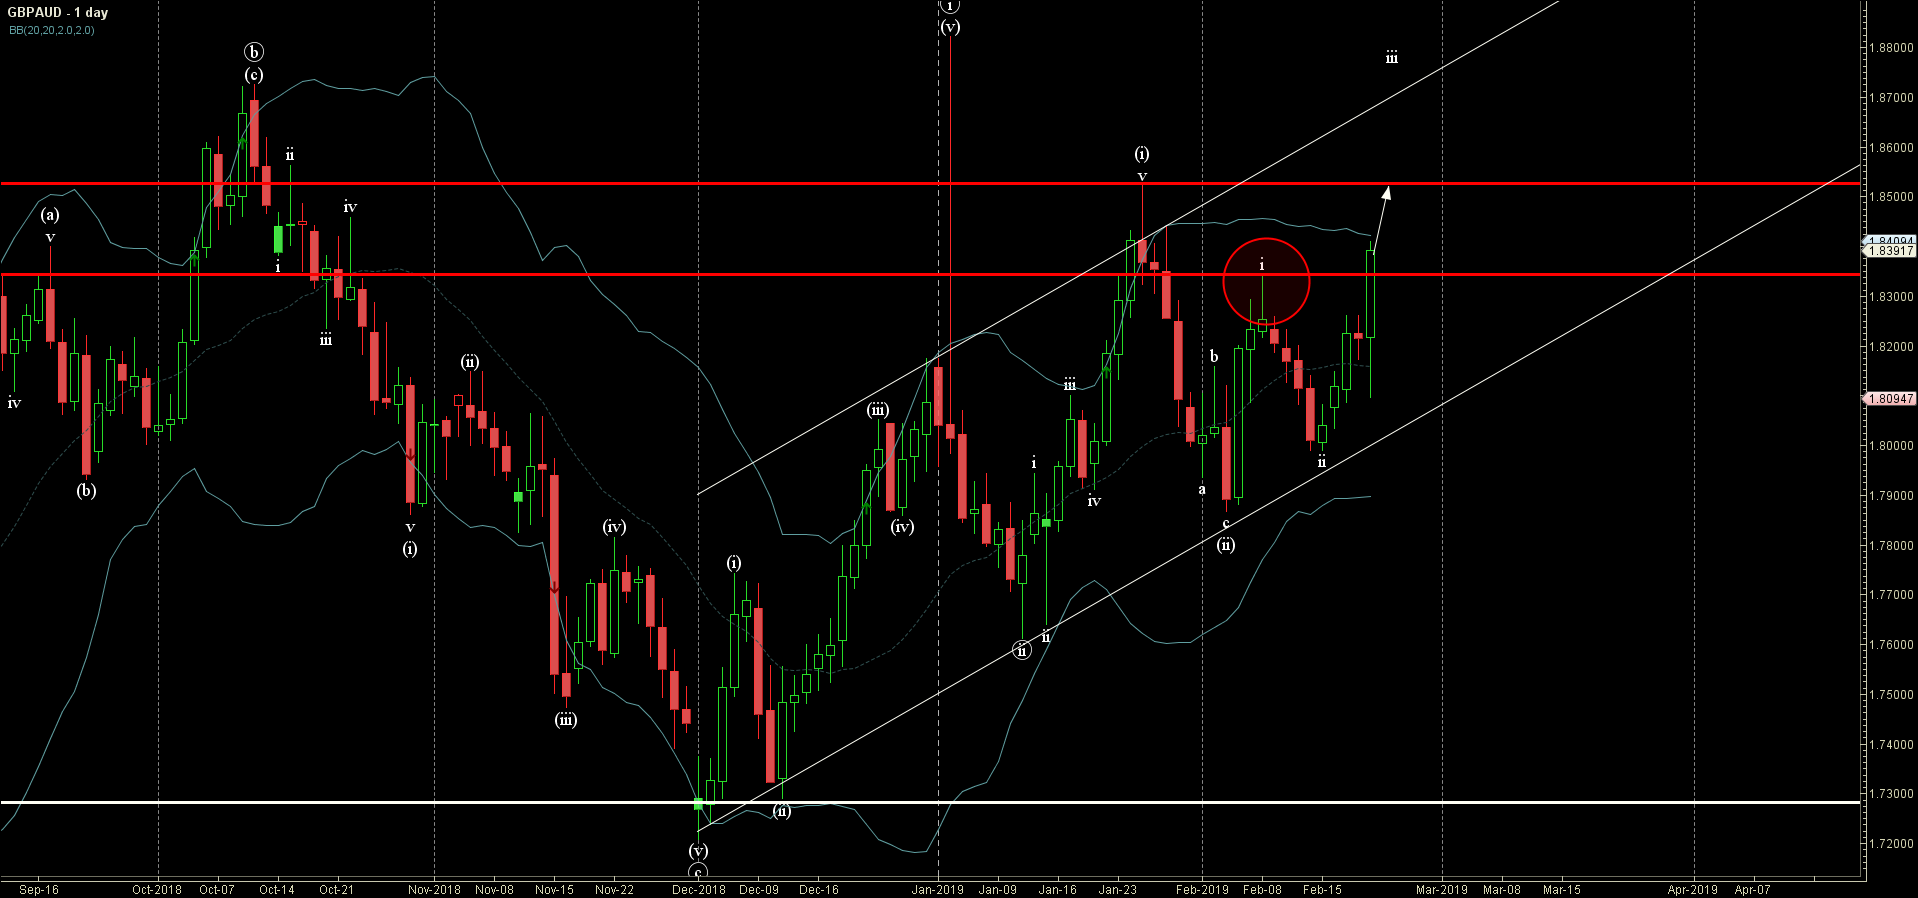
  • GBPAUD broke key resistance level 1.8340
  • Further gains are likely

GBPAUD recently broke through the key resistance level 1.8340 (which stopped the earlier impulse wave (i) with the daily Shooting Star earlier this month).

The breakout of the resistance level 1.8340 continues the active short-term impulse wave (iii) – which belong sot the impulse wave 3 from December.

GBPAUD is expected to rise further and re-test the next resistance level 1.8530 (monthly high from January).

The FxPro Tech Analysis Team

The FxPro technical experts prepare a daily analysis of the most active currency pairs (majors, crosses, exotics) and commodities. Selected instruments are reviewed on daily trends (D1, H4), using the active Elliott Wave setups, Japanese candlesticks, indicators, and support/resistance levels.

Share
Published by
The FxPro Tech Analysis Team
Tags: GBPAUD

Recent Posts

Crypto Market Tries to Break Local Downtrend 

Market picture  Crypto market capitalisation has been up 2% over the past seven days and…

7 mins ago

Adobe Wave Analysis 3 May 2024

- Adobe reversed from support zone - Likely to rise to resistance level 500.00 Adobe…

2 days ago

EURGBP Wave Analysis 3 May 2024

- EURJPY reversed from support zone - Likely to rise to resistance level 0.8625 EURGBP…

2 days ago

How Low Can the USDJPY Go?

USDJPY was slipping below 153 on Friday morning, a three-week low and having lost over…

3 days ago

Bitcoin’s Downtrend, Solana and Ethereum Form Double Bottom

Market picture  Crypto market capitalisation rose 3.3% in 24 hours to $2.22 trillion. Local capitalisation…

3 days ago

EURJPY Wave Analysis 2 May 2024

- EURJPY under strong bearish pressure - Likely to fall to support level 163.10 EURJPY…

4 days ago

This website uses cookies