Categories: Technical analysis

GBPAUD Wave Analysis – 06 April, 2020

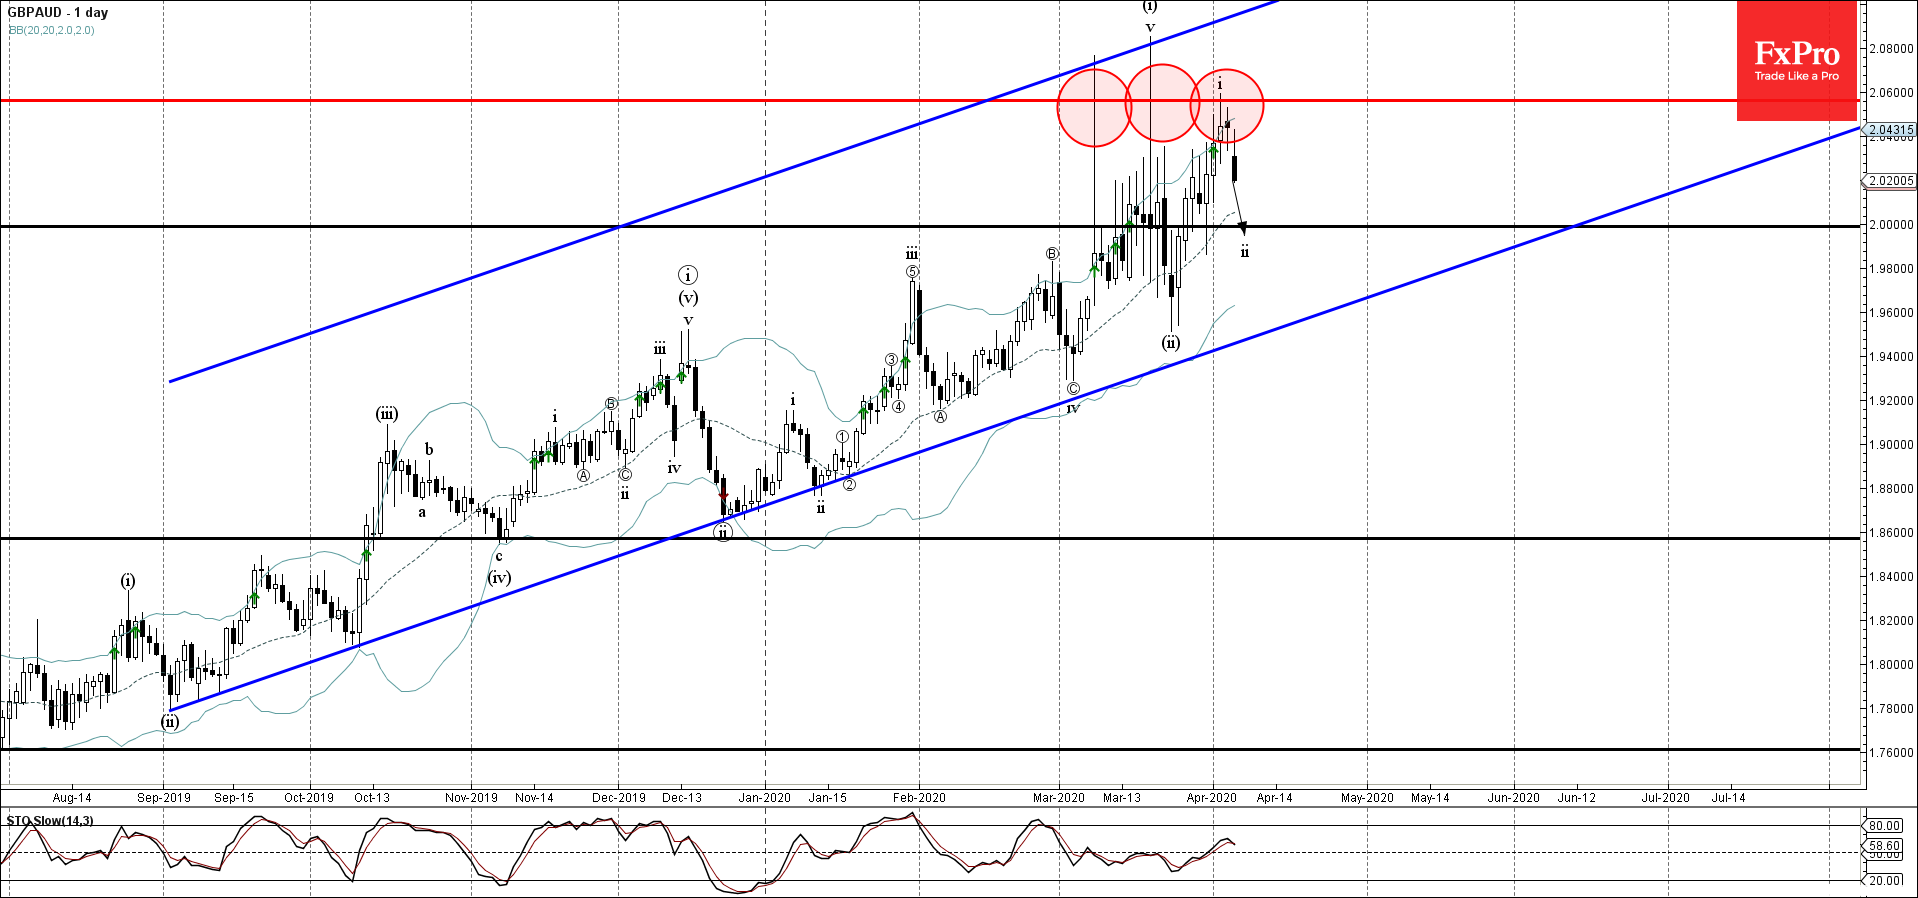
  • GBPAUD reversed from key resistance area
  • Likely to fall to 2.000

GBPAUD recently reversed down from the key resistance area lying between the major resistance level 2.0600 (which has been revering the price from the start of March) and the upper daily Bollinger Band.

The downward reversal from this resistance area started the active short-term corrective wave (ii).

GBPAUD is likely to fall further toward the next round support level 2.000 (former support from the end of March and the target for the completion of the active correction (ii)).

The FxPro Tech Analysis Team

The FxPro technical experts prepare a daily analysis of the most active currency pairs (majors, crosses, exotics) and commodities. Selected instruments are reviewed on daily trends (D1, H4), using the active Elliott Wave setups, Japanese candlesticks, indicators, and support/resistance levels.

Share
Published by
The FxPro Tech Analysis Team
Tags: GBPAUD

Recent Posts

Persisting pressure on crypto 

Market picture  The crypto market has lost 2% of its capitalisation over the last 24…

27 mins ago

S&P 500 Wave Analysis 7 May 2024

- S&P 500 reversed from support level 5000.00 - Likely to rise to resistance level…

14 hours ago

USDCHF Wave Analysis 7 May 2024

- USDCHF reversed from support zone - Likely to rise to resistance level 0.9200 USDCHF…

14 hours ago

EURUSD at the equilibrium, where will it go next?

The single currency is trading near $1.076, waiting for further cues and facing serious resistance…

19 hours ago

Bitcoin can’t accelerate but won’t give up trying

Market picture  The crypto market capitalisation fell by 1.7% in 24 hours to $2.29 trillion,…

24 hours ago

USDJPY Wave Analysis 6 May 2024

- USDJPY reversed from support zone - Likely to rise to resistance level 155.65 USDJPY…

2 days ago

This website uses cookies