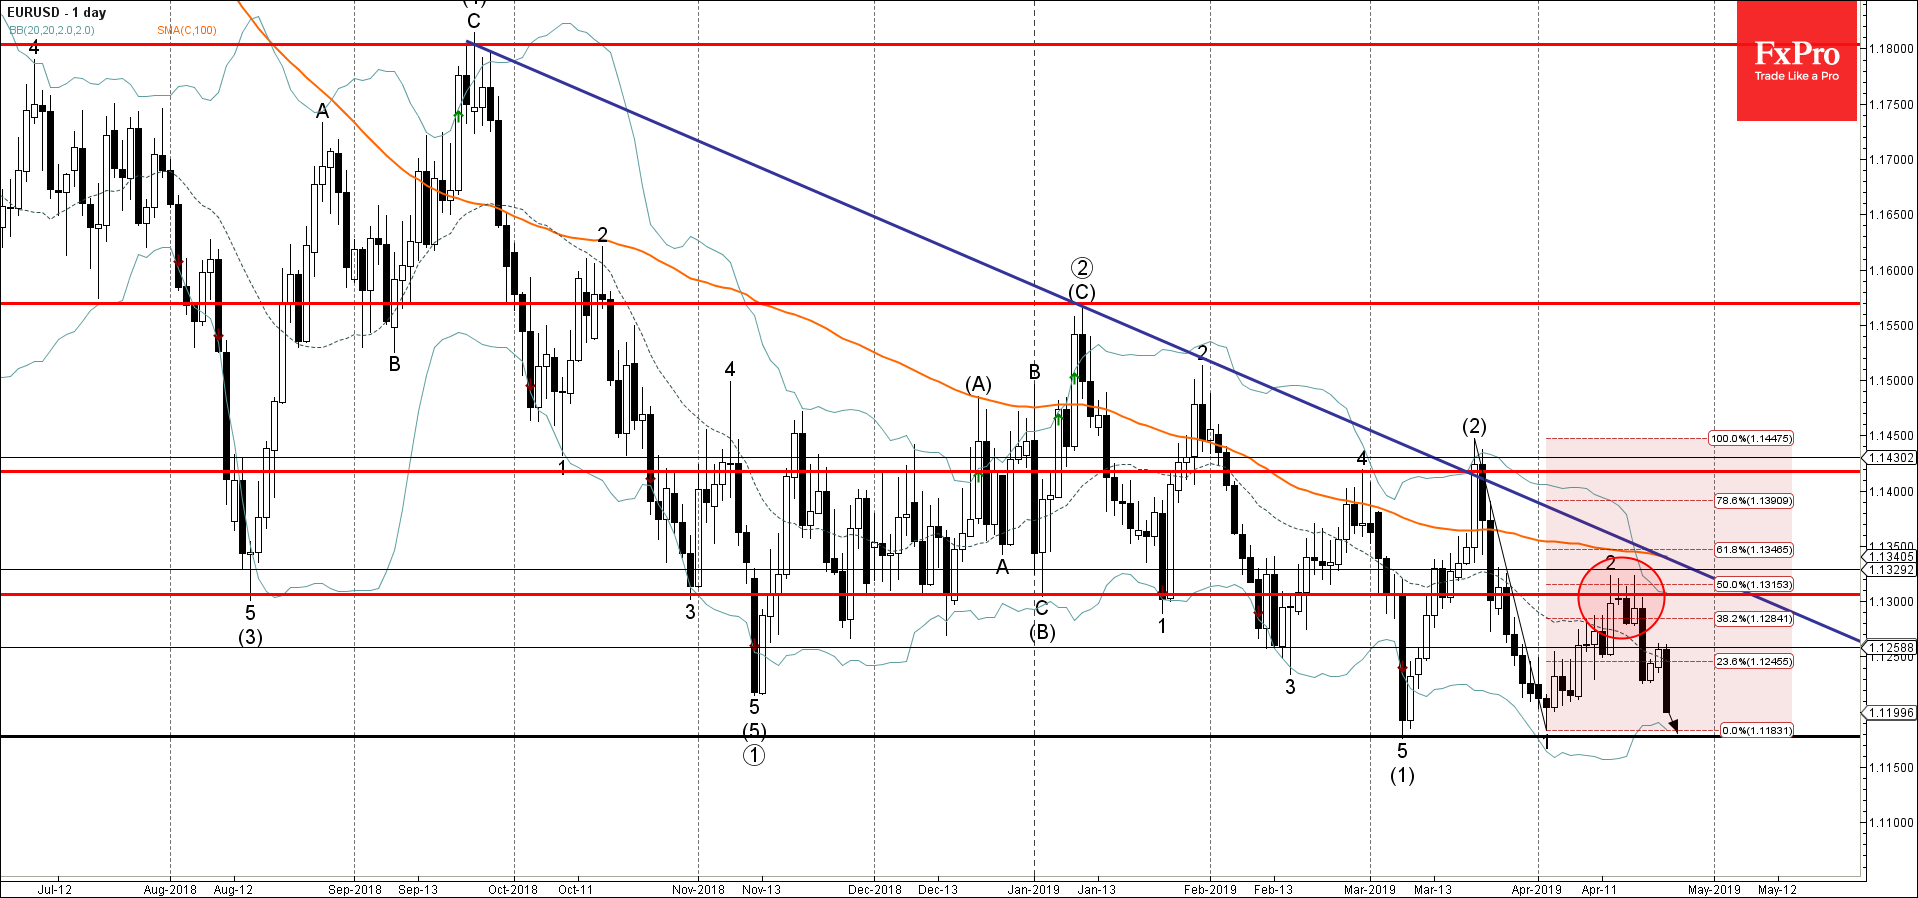
EURUSD has been falling in the last few trading sessions inside the short-term impulse wave 3 which started earlier from the resistance area lying between the resistance level 1.1300, 100-day moving average and the upper daily Bollinger Band.
This resistance area was further strengthened by the 100-day moving average and by the 50% Fibonacci correction of the previous downward impulse 1.
EURUSD is expected to fall further and re-test the next support level 1.1188 (low of the previous waves (1) and 1).
- Adobe reversed from support zone - Likely to rise to resistance level 500.00 Adobe…
- EURJPY reversed from support zone - Likely to rise to resistance level 0.8625 EURGBP…
USDJPY was slipping below 153 on Friday morning, a three-week low and having lost over…
Market picture Crypto market capitalisation rose 3.3% in 24 hours to $2.22 trillion. Local capitalisation…
- EURJPY under strong bearish pressure - Likely to fall to support level 163.10 EURJPY…
- WTI broke round support level 80.00 - Likely to fall to support level 76.00…
This website uses cookies