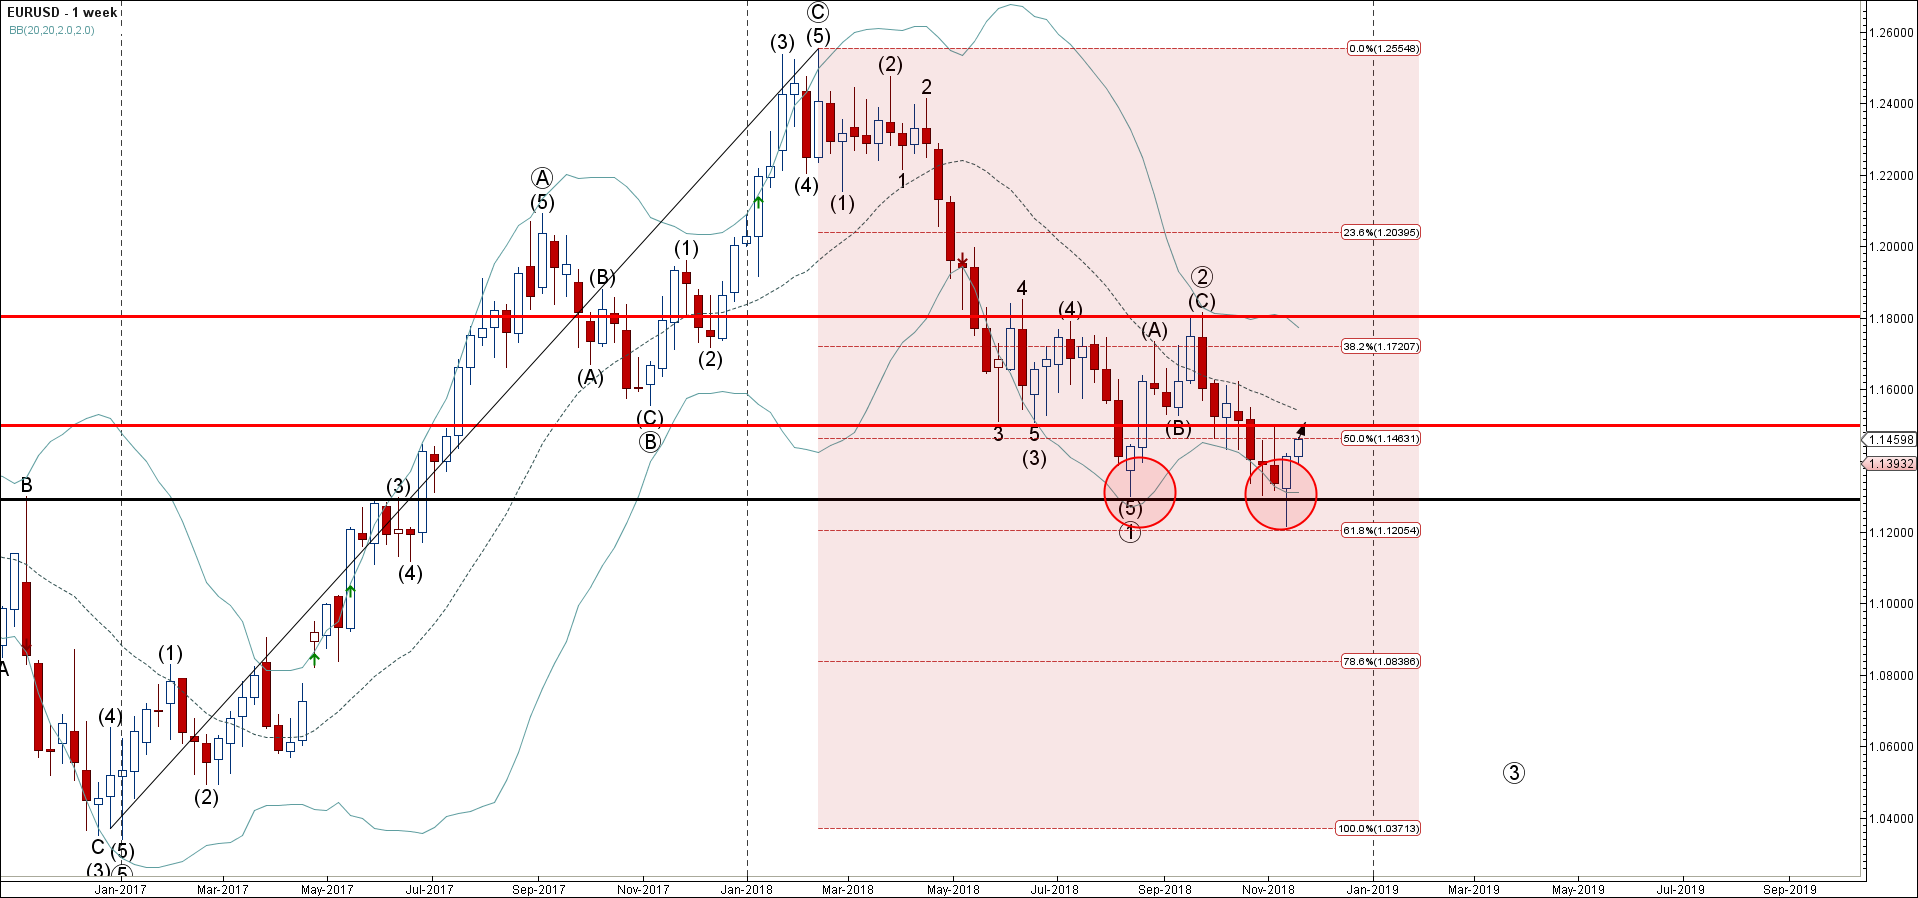
EURUSD has been rising in the last few trading sessions following the earlier upward reversal from the support area lying between the strong support level 1.1290 (monthly low from August), lower daily Bollinger Band and the 61.8% Fibonacci correction of the previous upward impulse from the end of 2016.
The upward reversal from this support area created the weekly Japanese candlesticks reversal pattern Bullish Engulfing.
EURUSD is expected to rise further and re-test the next key resistance level 1.1500 (which reversed the price earlier this month). Strong support remains at 1.1290.
- Brent crude oil reversed from key support level 81.00 - Likely to test resistance…
- Silver broke multi-year resistance level 29.50 - Likely to reach resistance level 32.00 Silver…
The US dollar is not giving up without a fight, gaining for the second day…
Silver climbed above $29.8, rewriting the highs from January 2021, but once again faced selling…
Market picture The crypto market cooled off on Thursday afternoon, but on Friday morning, buyers…
- Amazon reversed from resistance level 190.00 - Likely to fall to support level 180.00…
This website uses cookies