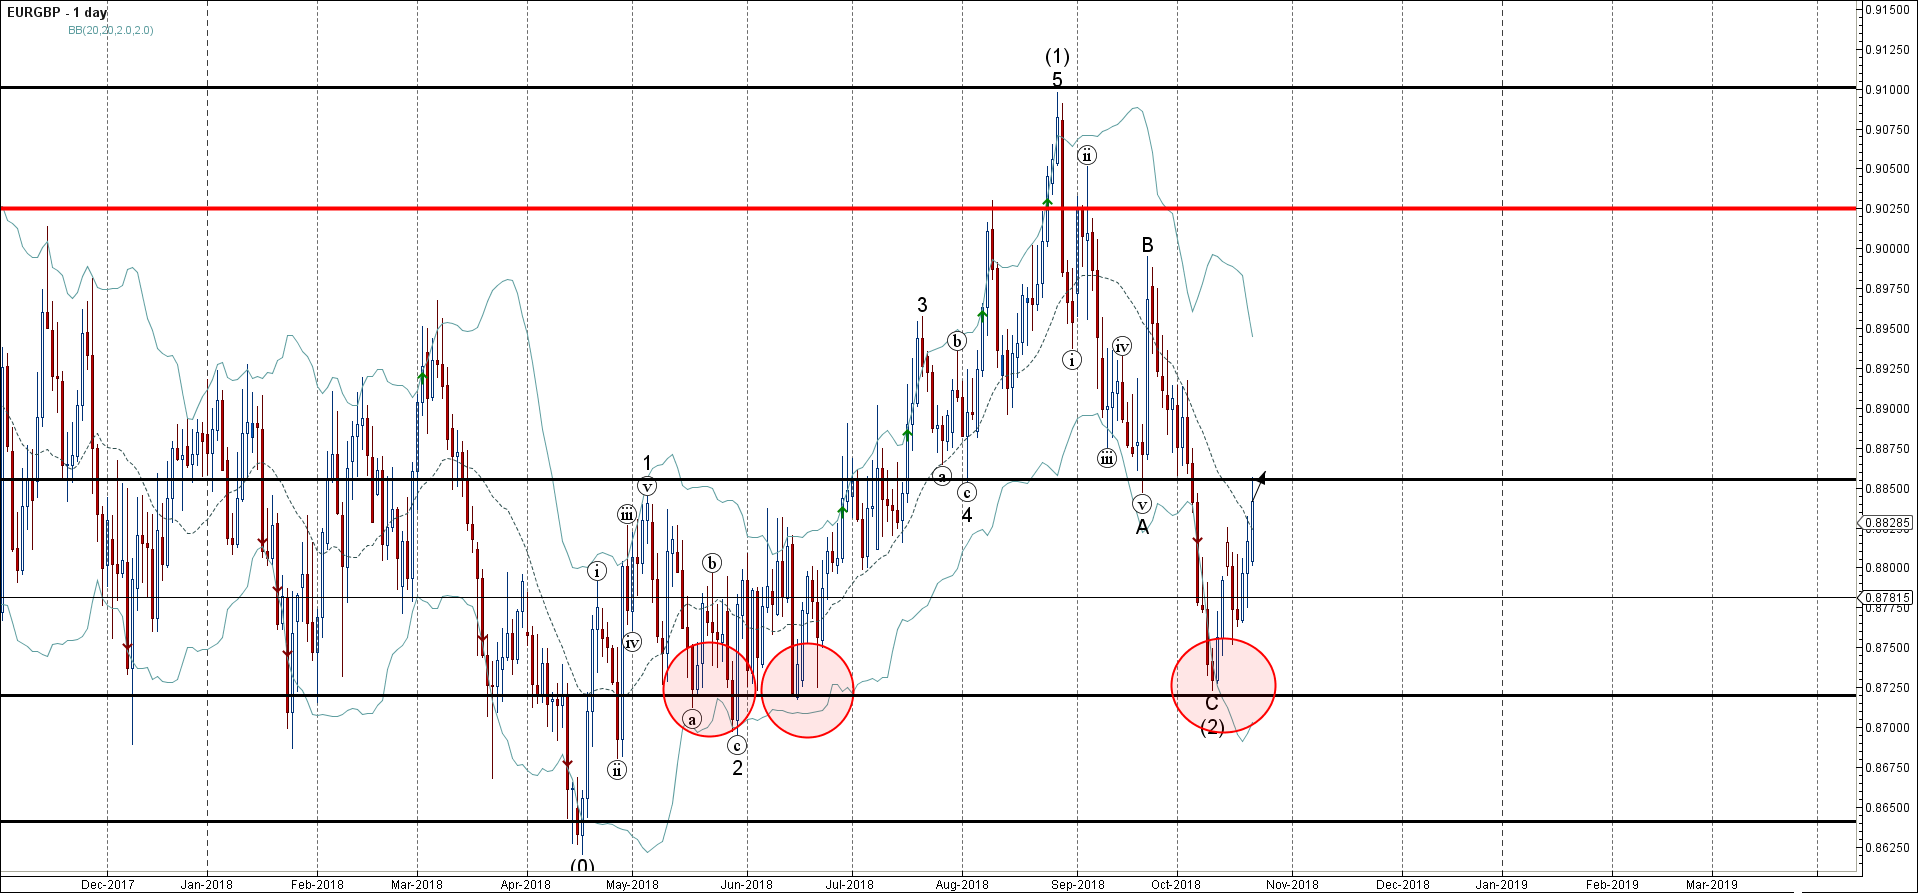
EURGBP continues to rise inside the medium-term impulse wave (3), which started earlier from the support area lying between the key support level 0.8725 (which has been reversing the price from May) and the lower daily Bollinger Band.
The upward reversal form the aforementioned support area created the daily Japanese candlesticks reversal pattern Morning Star.
EURGBP is expected to rise further and re-test the next strong resistance level 0.8850 (former strong support level which reversed the price in the middle of September).
The number of operating oil rigs in the US fell by 7 to 499. This…
Market picture Crypto market capitalisation has been up 2% over the past seven days and…
- Adobe reversed from support zone - Likely to rise to resistance level 500.00 Adobe…
- EURGBP reversed from support zone - Likely to rise to resistance level 0.8625 EURGBP…
USDJPY was slipping below 153 on Friday morning, a three-week low and having lost over…
Market picture Crypto market capitalisation rose 3.3% in 24 hours to $2.22 trillion. Local capitalisation…
This website uses cookies