Categories: Technical analysis

Dow Jones index Wave Analysis – 3 March 2023

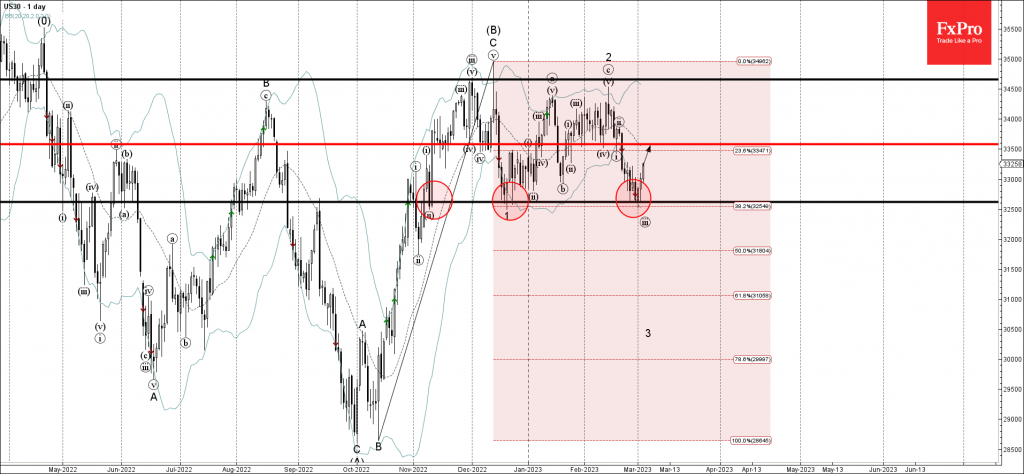
• Dow Jones index reversed from key support level 32620.00

• Likely to rise to resistance level 33585.00

Dow Jones index recently reversed up from the key support level 32620.00 (which has been reversing the price from the start of November) strengthened by the lower daily Bollinger Band and by the 38.2.% Fibonacci correction of the sharp upward impulse from October.

The upward reversal from the support level 32620.00 created the daily Japanese candlesticks pattern Bullish Engulfing.

Dow Jones index can be expected to rise to the next resistance level 33585.00 (former support from the start of February).

The FxPro Tech Analysis Team

The FxPro technical experts prepare a daily analysis of the most active currency pairs (majors, crosses, exotics) and commodities. Selected instruments are reviewed on daily trends (D1, H4), using the active Elliott Wave setups, Japanese candlesticks, indicators, and support/resistance levels.

Share
Published by
The FxPro Tech Analysis Team
Tags: Dow Jones

Recent Posts

USDJPY Wave Analysis 6 May 2024

- USDJPY reversed from support zone - Likely to rise to resistance level 155.65 USDJPY…

10 hours ago

Gold Wave Analysis 6 May 2024

- Gold reversed from support zone - Likely to rise to resistance level 2400.00 Gold…

10 hours ago

Oil Bounces Locally, Global Support 5% below Spot Price

The number of operating oil rigs in the US fell by 7 to 499. This…

14 hours ago

Crypto Market Tries to Break Local Downtrend

Market picture  Crypto market capitalisation has been up 2% over the past seven days and…

21 hours ago

Adobe Wave Analysis 3 May 2024

- Adobe reversed from support zone - Likely to rise to resistance level 500.00 Adobe…

3 days ago

EURGBP Wave Analysis 3 May 2024

- EURGBP reversed from support zone - Likely to rise to resistance level 0.8625 EURGBP…

3 days ago

This website uses cookies