Categories: Technical analysis

Cotton Wave Analysis – 13 September, 2019

  • Cotton reversed from support zone
  • Further gains are likely

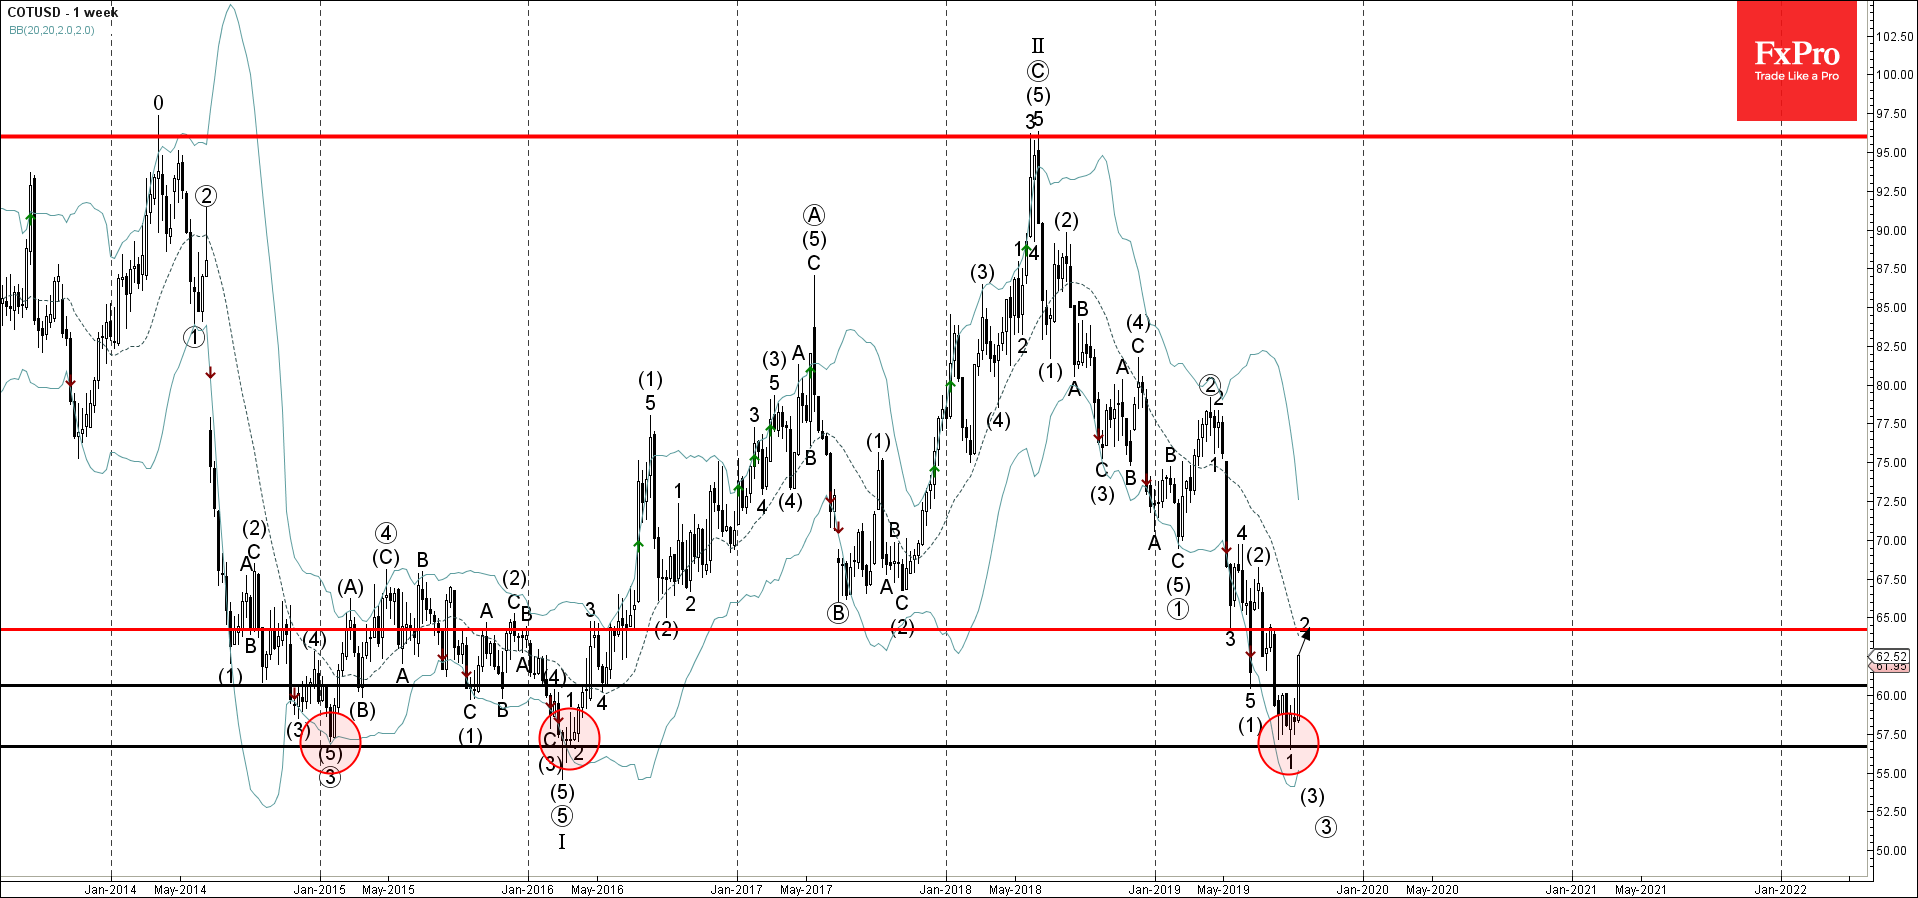
Cotton recently reversed up from the support zone lying between the long-term support level 56.70 (which has been reversing the price from the start of 2015) and the lower weekly Bollinger Band.

The upward reversal from this support zone started the active short-term corrective wave 2.

Cotton is expected to rise further and retest the next resistance level 64.23 (target price for the completion of the active wave 2). Strong support remains at the support level 56.70.

The FxPro Tech Analysis Team

The FxPro technical experts prepare a daily analysis of the most active currency pairs (majors, crosses, exotics) and commodities. Selected instruments are reviewed on daily trends (D1, H4), using the active Elliott Wave setups, Japanese candlesticks, indicators, and support/resistance levels.

Share
Published by
The FxPro Tech Analysis Team
Tags: COTUSD

Recent Posts

ADP hints at another strong NFP on Friday  

The monthly ADP labour market report showed that America created 192K new jobs in April, above…

17 hours ago

Fed’s hawkish tone risks sinking S&P500 to 4700

Bears showed strength ahead of the FOMC decision.  U.S. indices sagged on Tuesday as investors…

21 hours ago

A new stage of Bitcoin’s decline

Market Picture  Bitcoin's closing price on Tuesday became the lowest since late February, confirming the…

1 day ago

Ebay Wave Analysis 30 April 2024

- Ebay under the bearish pressure - Likely to fall to support level 51.00 Ebay…

2 days ago

GBPAUD Wave Analysis 30 April 2024

- GBPAUD reversed from key support level 1.9135 - Likely to rise to resistance level…

2 days ago

Silver: a possible long road down

Silver has lost 2.6% since the start of the day on Tuesday to $26.4 per…

2 days ago

This website uses cookies