Categories: Technical analysis

Cotton Wave Analysis – 03 August, 2020

• Cotton broke daily down channel

• Likely to rise to 64.60

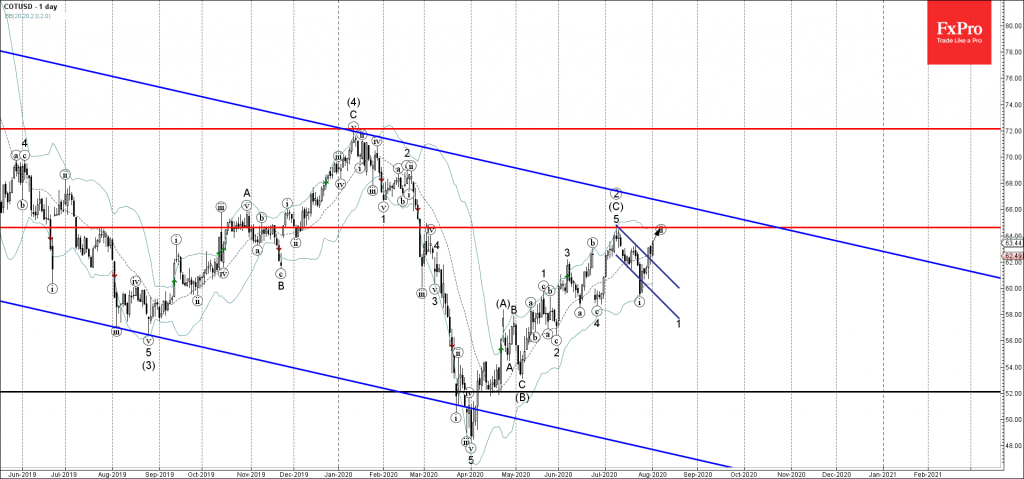
Cotton recently broke the resistance trendline of the narrow daily down channel from the start of July (which enclosed the most of the previous short-term impulse wave (i))

The breakout of this down channel continues the active short-term corrective wave (ii) from the end of July.

Cotton is expected to rise further toward the next resistance level 64.60 (target price for the completion of the active corrective wave (ii)).

The FxPro Tech Analysis Team

The FxPro technical experts prepare a daily analysis of the most active currency pairs (majors, crosses, exotics) and commodities. Selected instruments are reviewed on daily trends (D1, H4), using the active Elliott Wave setups, Japanese candlesticks, indicators, and support/resistance levels.

Share
Published by
The FxPro Tech Analysis Team
Tags: COTUSD

Recent Posts

USDJPY Wave Analysis 6 May 2024

- USDJPY reversed from support zone - Likely to rise to resistance level 155.65 USDJPY…

3 hours ago

Gold Wave Analysis 6 May 2024

- Gold reversed from support zone - Likely to rise to resistance level 2400.00 Gold…

3 hours ago

Oil Bounces Locally, Global Support 5% below Spot Price

The number of operating oil rigs in the US fell by 7 to 499. This…

8 hours ago

Crypto Market Tries to Break Local Downtrend

Market picture  Crypto market capitalisation has been up 2% over the past seven days and…

14 hours ago

Adobe Wave Analysis 3 May 2024

- Adobe reversed from support zone - Likely to rise to resistance level 500.00 Adobe…

3 days ago

EURGBP Wave Analysis 3 May 2024

- EURGBP reversed from support zone - Likely to rise to resistance level 0.8625 EURGBP…

3 days ago

This website uses cookies