Categories: Technical analysis

Costco Wave Analysis – 23 June, 2020

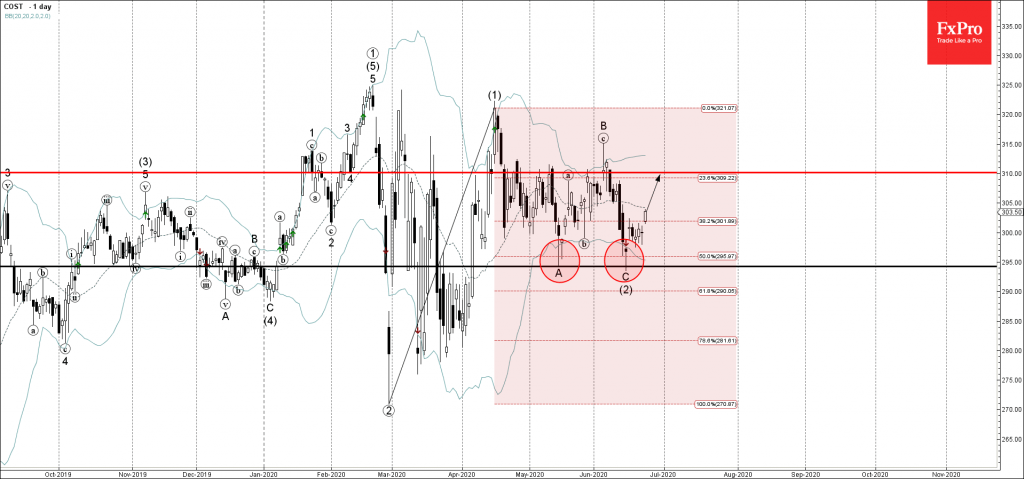
• Costco rising inside impulse wave (3)
• Likely to rise 310.00

Costco recently reversed up sharply from the key support area between the pivotal support level 295.00 (monthly low fr0m May), lower daily Bollinger band and the 50% Fibonacci correction of the previous upward impulse (1) from the end of February.

The upward reversal from this support zone created the daily candlesticks reversal pattern Hammer Doji – which started the active impulse wave (3).

Costco is likely to rise further toward the next resistance level 310.00 (former pivotal resistance from May).

The FxPro Tech Analysis Team

The FxPro technical experts prepare a daily analysis of the most active currency pairs (majors, crosses, exotics) and commodities. Selected instruments are reviewed on daily trends (D1, H4), using the active Elliott Wave setups, Japanese candlesticks, indicators, and support/resistance levels.

Share
Published by
The FxPro Tech Analysis Team
Tags: COST

Recent Posts

Adobe Wave Analysis 3 May 2024

- Adobe reversed from support zone - Likely to rise to resistance level 500.00 Adobe…

8 hours ago

EURGBP Wave Analysis 3 May 2024

- EURJPY reversed from support zone - Likely to rise to resistance level 0.8625 EURGBP…

8 hours ago

How Low Can the USDJPY Go?

USDJPY was slipping below 153 on Friday morning, a three-week low and having lost over…

15 hours ago

Bitcoin’s Downtrend, Solana and Ethereum Form Double Bottom

Market picture  Crypto market capitalisation rose 3.3% in 24 hours to $2.22 trillion. Local capitalisation…

20 hours ago

EURJPY Wave Analysis 2 May 2024

- EURJPY under strong bearish pressure - Likely to fall to support level 163.10 EURJPY…

1 day ago

WTI crude oil Wave Analysis 2 May 2024

- WTI broke round support level 80.00 - Likely to fall to support level 76.00…

1 day ago

This website uses cookies