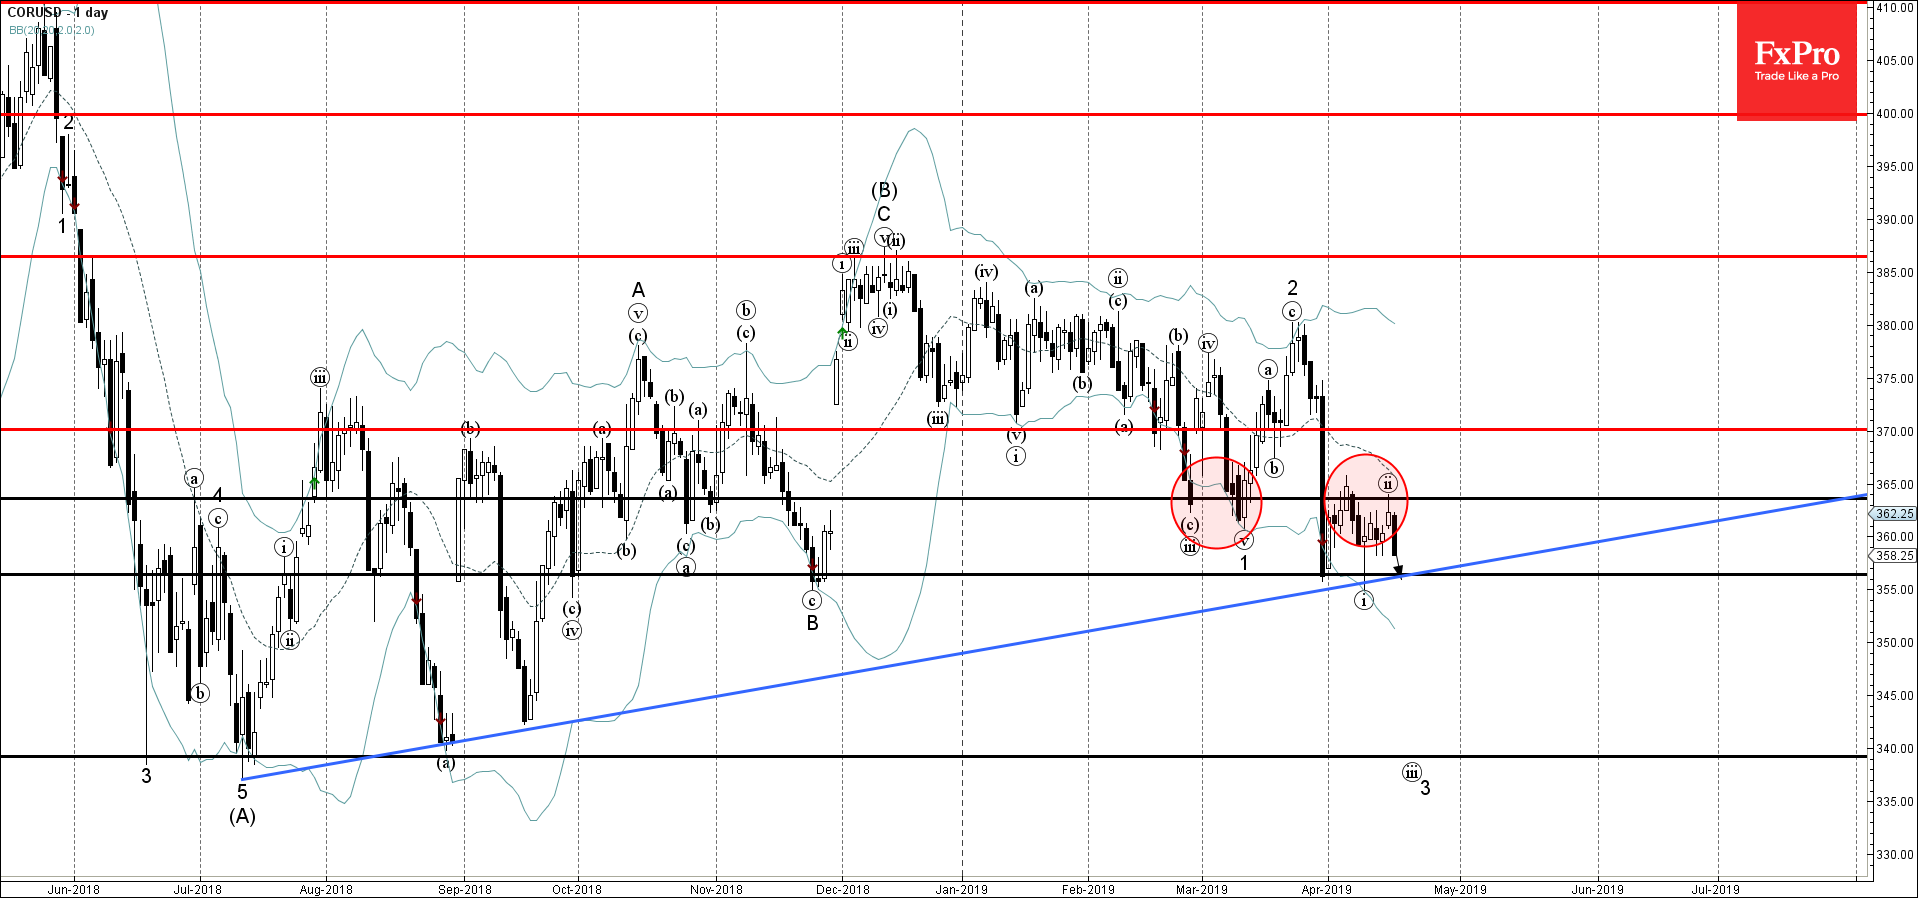
Corn recently reversed down from the pivotal resistance level 360.00 (former strong support from February and March) – which also reversed the price earlier this month.
The downward reversal from the resistance level 360.00 started the active short-term impulse wave (iii) of the longer-term downward impulse wave (C) from December.
Corn is expected to fall further and re-test the next key support level 350.00 (low of the previous impulse wave (i) ).
- Adobe reversed from support zone - Likely to rise to resistance level 500.00 Adobe…
- EURJPY reversed from support zone - Likely to rise to resistance level 0.8625 EURGBP…
USDJPY was slipping below 153 on Friday morning, a three-week low and having lost over…
Market picture Crypto market capitalisation rose 3.3% in 24 hours to $2.22 trillion. Local capitalisation…
- EURJPY under strong bearish pressure - Likely to fall to support level 163.10 EURJPY…
- WTI broke round support level 80.00 - Likely to fall to support level 76.00…
This website uses cookies