Categories: Technical analysis

Copper Wave Analysis – 14 July, 2020

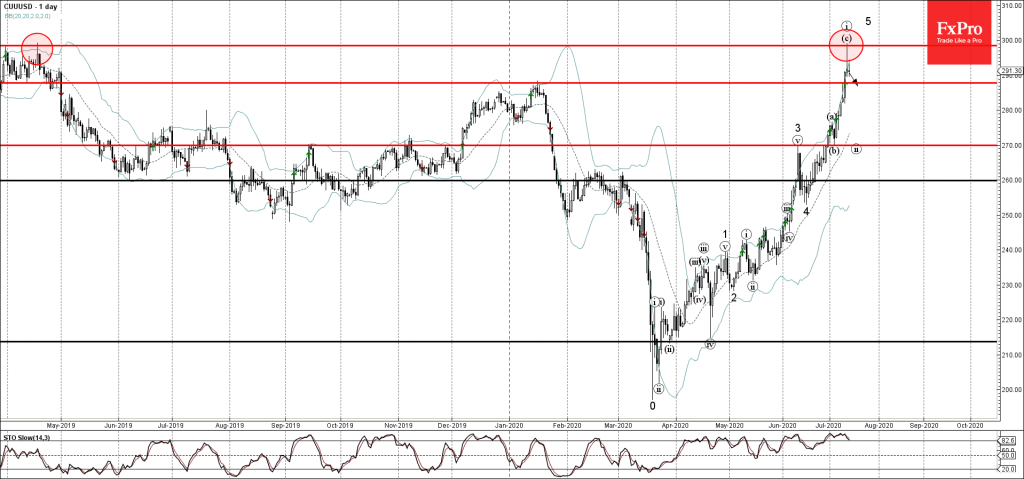
• Copper reversed from long-term resistance level 299,00

• Likely to correct down to 287,80

Copper recently reversed down with the long daily Shooting Star from the resistance area located between the long-term resistance level 299,00 (former monthly high from April of 2019) and the upper daily Bollinger Band.

The downward reversal from this resistance area started the active short-term corrective wave (ii).

Given the overbought reading on the daily Stochastic indicator – Copper is likely to correct down to 287,80– after which the price is likely to test the resistance level 300.00.

The FxPro Tech Analysis Team

The FxPro technical experts prepare a daily analysis of the most active currency pairs (majors, crosses, exotics) and commodities. Selected instruments are reviewed on daily trends (D1, H4), using the active Elliott Wave setups, Japanese candlesticks, indicators, and support/resistance levels.

Share
Published by
The FxPro Tech Analysis Team
Tags: Copper

Recent Posts

USDJPY Wave Analysis 26 April 2024

- USDJPY broke key resistance level 155.00 - Likely to rise to resistance level 160.00…

2 days ago

Ebay Wave Analysis 26 April 2024

- Ebay reversed from support level 49.35 - Likely to rise to resistance level 52.55…

2 days ago

False Alert with Yen Interventions?

Even though the Bank of Japan left the key rate and parameters of the QE…

2 days ago

Cooler Bitcoin

Market picture  Market Dynamics: The cryptocurrency market stabilised, losing just 0.1% of capitalisation and dropping to…

3 days ago

GBPCAD Wave Analysis 25 April 2024

- GBPCAD reversed from key support level 1.6910 - Likely to rise to resistance level…

3 days ago

GBPAUD Wave Analysis 25 April 2024

- GBPAUD reversed from support level 1.9135 - Likely to rise to resistance level 1.9360…

3 days ago

This website uses cookies