Categories: Technical analysis

Coca-Cola Wave Analysis – 11 June, 2020

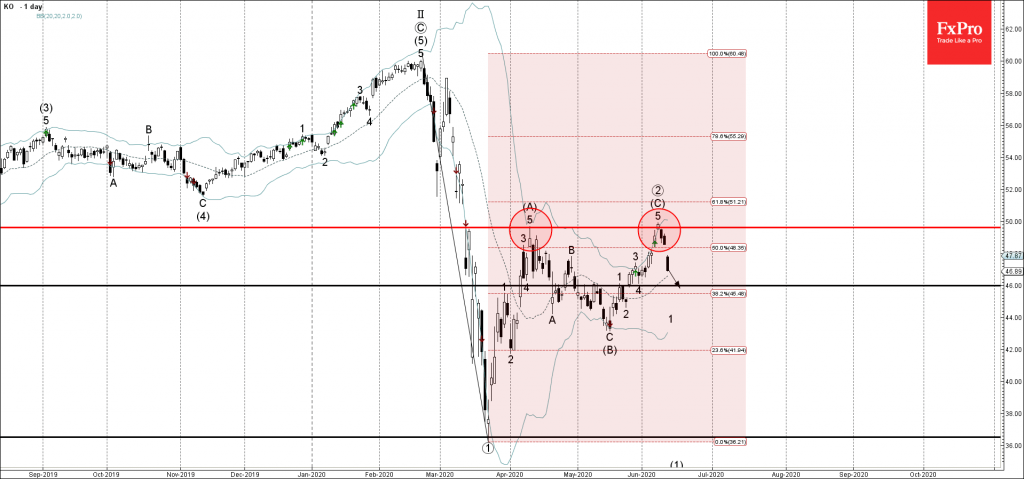
• Coca-Cola falling inside impulse wave ③

• Likely to fall to 46,00

Coca-Cola recently reversed down sharply from the resistance zone located between the resistance level 49.60 (top of the previous wave (A)) and the upper daily Bollinger Band.

The downward reversal from this resistance zone created the combined daily Japanese candlesticks reversal pattern Evening Star – which started the active impulse wave ③.

Coca-Cola is likely to fall further toward the next support level 46,00 (low of the previous minor correction 4 from the end of May).

The FxPro Tech Analysis Team

The FxPro technical experts prepare a daily analysis of the most active currency pairs (majors, crosses, exotics) and commodities. Selected instruments are reviewed on daily trends (D1, H4), using the active Elliott Wave setups, Japanese candlesticks, indicators, and support/resistance levels.

Share
Published by
The FxPro Tech Analysis Team
Tags: KO

Recent Posts

How Low Can the USDJPY Go? 

USDJPY was slipping below 153 on Friday morning, a three-week low and having lost over…

25 mins ago

Bitcoin’s Downtrend, Solana and Ethereum Form Double Bottom

Market picture  Crypto market capitalisation rose 3.3% in 24 hours to $2.22 trillion. Local capitalisation…

6 hours ago

EURJPY Wave Analysis 2 May 2024

- EURJPY under strong bearish pressure - Likely to fall to support level 163.10 EURJPY…

20 hours ago

WTI crude oil Wave Analysis 2 May 2024

- WTI broke round support level 80.00 - Likely to fall to support level 76.00…

20 hours ago

ADP hints at another strong NFP on Friday

The monthly ADP labour market report showed that America created 192K new jobs in April, above…

2 days ago

Fed’s hawkish tone risks sinking S&P500 to 4700

Bears showed strength ahead of the FOMC decision.  U.S. indices sagged on Tuesday as investors…

2 days ago

This website uses cookies