Categories: Technical analysis

CHFJPY Wave Analysis – 14 April, 2022

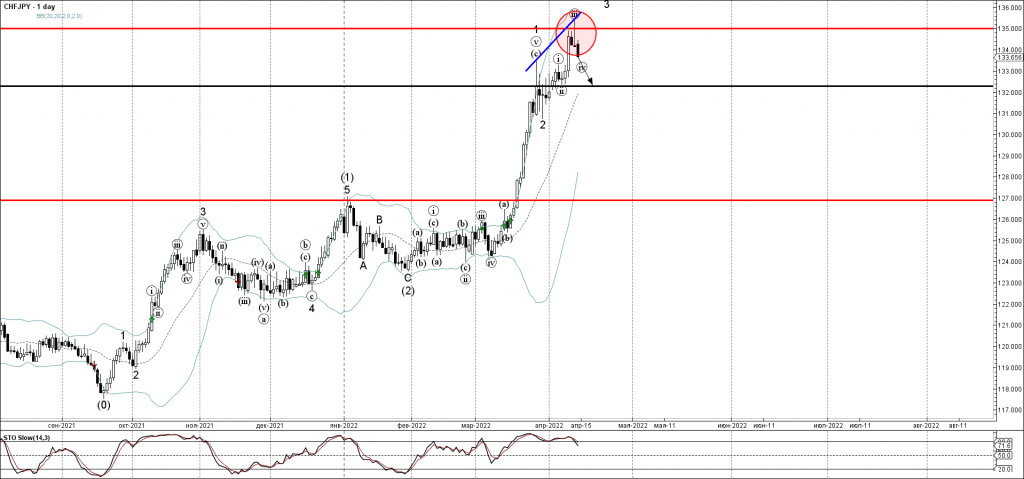
• Reversed from resistance level 134.60
• Likely to fall to support level 132.00

CHFJPY currency pair recently reversed down from the key round resistance level 134.60 (previous multi-month high from 2015) – standing near the upper daily and weekly Bollinger Bands.

The downward reversal from the resistance level 134.60 created the daily candlesticks reversal pattern Shooting Star.

Given the strength of the resistance level 134.60 and the clear bearish divergence on the daily Stochastic – CHFJPY can be expected to fall toward the next support level 132.00 (low of wave (ii)).

The FxPro Tech Analysis Team

The FxPro technical experts prepare a daily analysis of the most active currency pairs (majors, crosses, exotics) and commodities. Selected instruments are reviewed on daily trends (D1, H4), using the active Elliott Wave setups, Japanese candlesticks, indicators, and support/resistance levels.

Share
Published by
The FxPro Tech Analysis Team
Tags: CHFJPY

Recent Posts

EURUSD at the equilibrium, where will it go next? 

The single currency is trading near $1.076, waiting for further cues and facing serious resistance…

4 hours ago

Bitcoin can’t accelerate but won’t give up trying

Market picture  The crypto market capitalisation fell by 1.7% in 24 hours to $2.29 trillion,…

9 hours ago

USDJPY Wave Analysis 6 May 2024

- USDJPY reversed from support zone - Likely to rise to resistance level 155.65 USDJPY…

24 hours ago

Gold Wave Analysis 6 May 2024

- Gold reversed from support zone - Likely to rise to resistance level 2400.00 Gold…

24 hours ago

Oil Bounces Locally, Global Support 5% below Spot Price

The number of operating oil rigs in the US fell by 7 to 499. This…

1 day ago

Crypto Market Tries to Break Local Downtrend

Market picture  Crypto market capitalisation has been up 2% over the past seven days and…

1 day ago

This website uses cookies