Categories: Technical analysis

CADCHF Analysis 04 November, 2020

• CADCHF reversed from resistance area

• Likely to fall to 0.6850                                                                                           

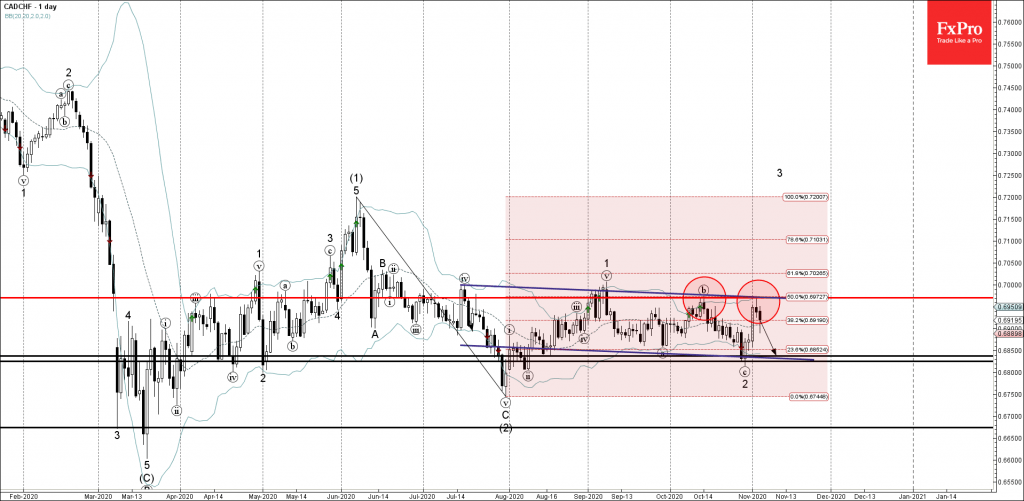
CADCHF recently reversed down from resistance area made out of the resistance level 0.6970 (top of wave (b)), upper daily Bollinger Band and the resistance trendline of the daily down channel from July.

The downward reversal from this resistance area created the daily Japanese candlesticks reversal pattern Doji.

CADCHF is likely to fall further toward the next support level 0.6850 (intersecting with the lower trendline of the daily down channel from July).

The FxPro Tech Analysis Team

The FxPro technical experts prepare a daily analysis of the most active currency pairs (majors, crosses, exotics) and commodities. Selected instruments are reviewed on daily trends (D1, H4), using the active Elliott Wave setups, Japanese candlesticks, indicators, and support/resistance levels.

Share
Published by
The FxPro Tech Analysis Team
Tags: CADCHF

Recent Posts

EURJPY Wave Analysis 20 May 2024

- EURJPY broke resistance level 169.40 - Likely to rise to resistance level 171.00 EURJPY…

5 hours ago

EURJPY Wave Analysis 20 May 2024

- EURJPY broke resistance level 169.40 - Likely to rise to resistance level 171.00 EURJPY…

5 hours ago

Natural gas Wave Analysis 20 May 2024

- Natural gas rising inside impulse waves 3 and (1) - Likely to reach resistance…

5 hours ago

Oil shows weakness

Oil is losing about 0.75% of its peak on Monday, having hit a strengthening sell-off…

12 hours ago

Bitcoin cautious despite global rise in risk appetite

Market picture Crypto market capitalisation rose 5.2% over the past seven days to $2.41 trillion.…

16 hours ago

Brent crude oil Wave Analysis 17 May 2024

- Brent crude oil reversed from key support level 81.00 - Likely to test resistance…

3 days ago

This website uses cookies