Categories: Technical analysis

Brent Wave Analysis – 11 February, 2022

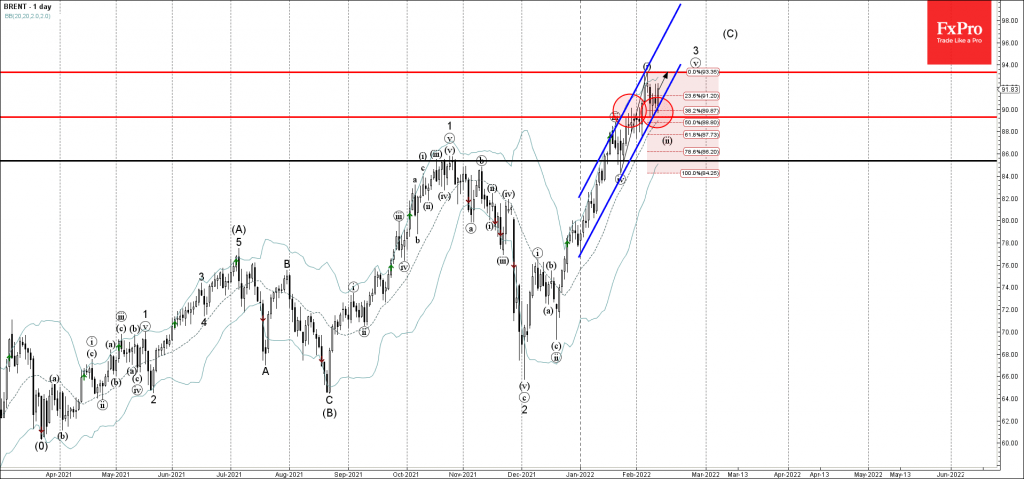
• Brent reversed from support zone

• Likely to rise to resistance level 93.35

Brent recently reversed up from the support area located between the key support level 90.00 (former resistance from January), 38.2% Fibonacci correction of the upward impulse (i) from January and the support trendline of the daily up channel from December.

The upward reversal from this support area continues the active short-term impulse waves (iii), 3 and (C).

Given the clear daily uptrend, Brent can be expected to rise further toward the next resistance level 93.35 (top of the previous impulse waves (i)).

The FxPro Tech Analysis Team

The FxPro technical experts prepare a daily analysis of the most active currency pairs (majors, crosses, exotics) and commodities. Selected instruments are reviewed on daily trends (D1, H4), using the active Elliott Wave setups, Japanese candlesticks, indicators, and support/resistance levels.

Share
Published by
The FxPro Tech Analysis Team
Tags: brent

Recent Posts

WTI crude oil Wave Analysis 8 May 2024

- WTI crude oil reversed from support area - Likely to rise to resistance level…

3 hours ago

AUDJPY Wave Analysis 8 May 2024

- AUDJPY reversed from support area - Likely to rise to resistance level 103.00 AUDJPY…

3 hours ago

German industrial production slide brings closer ECB’s rate cut

German industrial production continues to decline. The rate of contraction in March was slightly better…

9 hours ago

US indices are heading towards highs

US indices have been gaining daily since the beginning of May. They have found strength…

11 hours ago

Persisting pressure on crypto

Market picture  The crypto market has lost 2% of its capitalisation over the last 24…

14 hours ago

S&P 500 Wave Analysis 7 May 2024

- S&P 500 reversed from support level 5000.00 - Likely to rise to resistance level…

1 day ago

This website uses cookies