Categories: Technical analysis

Bank of America Wave Analysis – 04 December, 2019

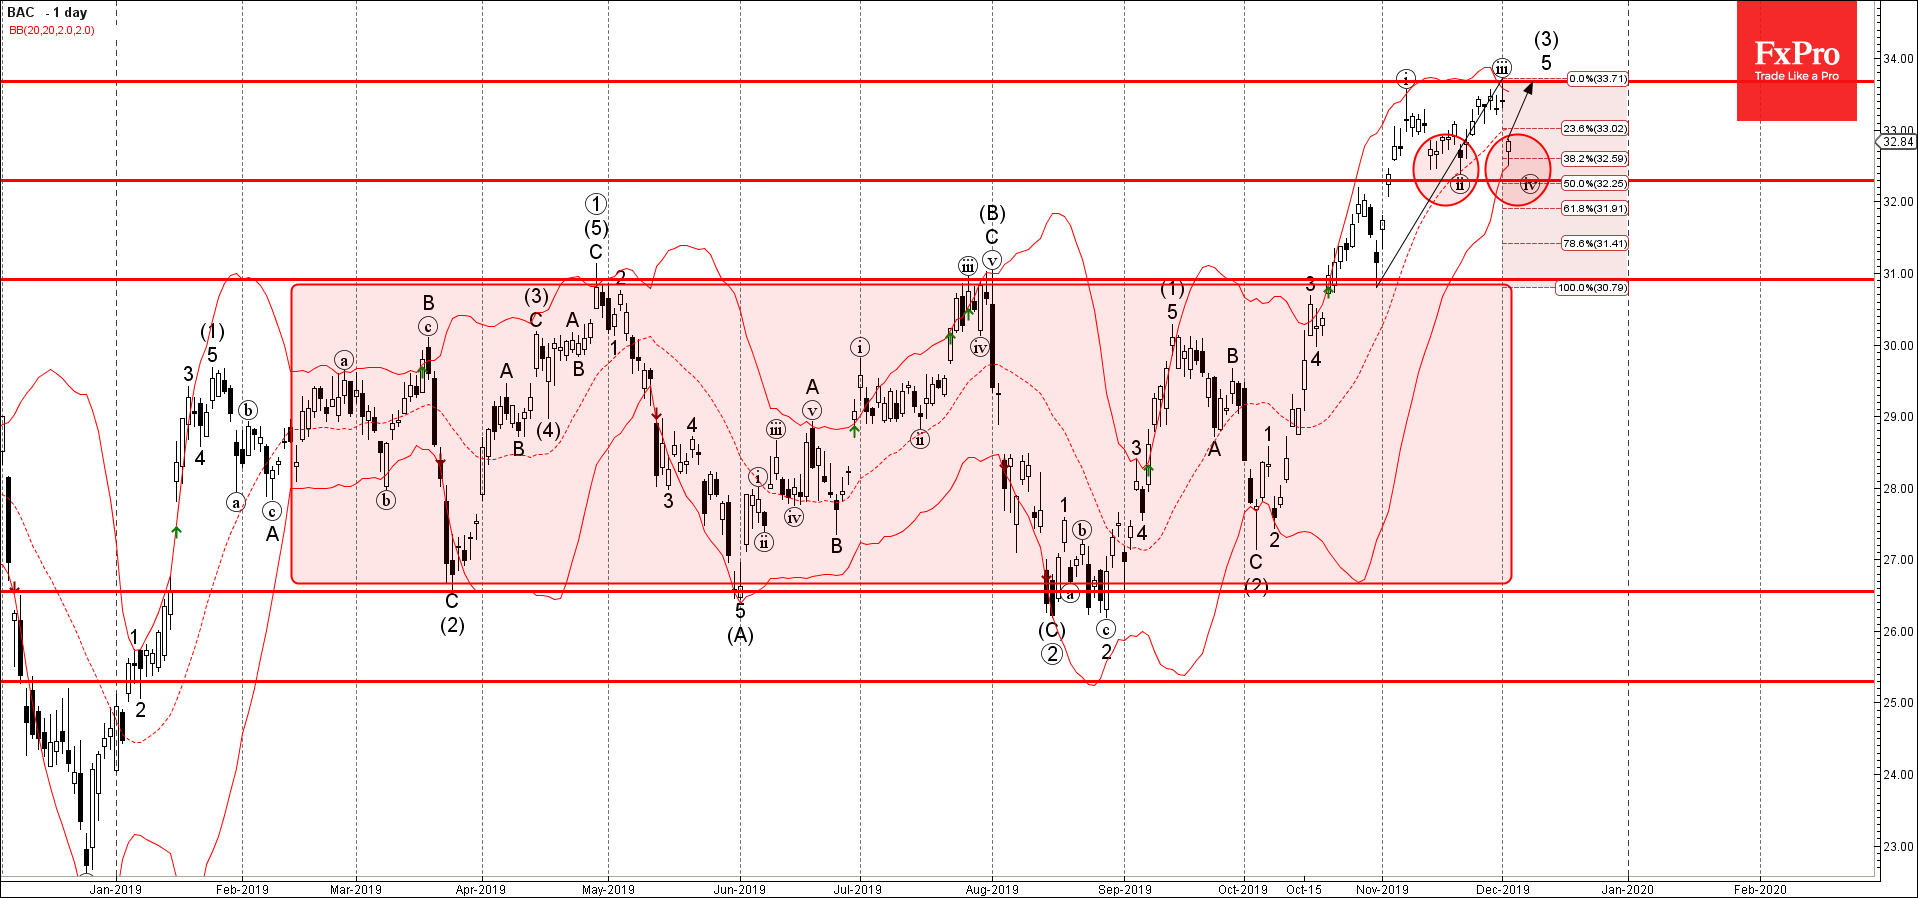
  • Bank of America reversed from support area
  • Likely to rise to 33.65

Bank of America recently reversed up from the support area lying between the key support level 32.30 (low of the previous wave (ii)), lower daily Bollinger Band and the 50% Fibonacci correction of the previous upward impulse from October.

The upward reversal from this support area stopped the earlier correction (iv) of the impulse wave 5 of the impulse sequence (3).

Bank of America is expected to rise further toward the next resistance level 33.65 (top of the previous impulse waves (i) and (iii) from last month).

The FxPro Tech Analysis Team

The FxPro technical experts prepare a daily analysis of the most active currency pairs (majors, crosses, exotics) and commodities. Selected instruments are reviewed on daily trends (D1, H4), using the active Elliott Wave setups, Japanese candlesticks, indicators, and support/resistance levels.

Share
Published by
The FxPro Tech Analysis Team
Tags: BAC

Recent Posts

USDJPY Wave Analysis 26 April 2024

- USDJPY broke key resistance level 155.00 - Likely to rise to resistance level 160.00…

2 days ago

Ebay Wave Analysis 26 April 2024

- Ebay reversed from support level 49.35 - Likely to rise to resistance level 52.55…

2 days ago

False Alert with Yen Interventions?

Even though the Bank of Japan left the key rate and parameters of the QE…

3 days ago

Cooler Bitcoin

Market picture  Market Dynamics: The cryptocurrency market stabilised, losing just 0.1% of capitalisation and dropping to…

3 days ago

GBPCAD Wave Analysis 25 April 2024

- GBPCAD reversed from key support level 1.6910 - Likely to rise to resistance level…

4 days ago

GBPAUD Wave Analysis 25 April 2024

- GBPAUD reversed from support level 1.9135 - Likely to rise to resistance level 1.9360…

4 days ago

This website uses cookies