Technical analysis
AXA Wave Analysis – 19 November, 2021
November 19, 2021 @ 13:16 +03:00

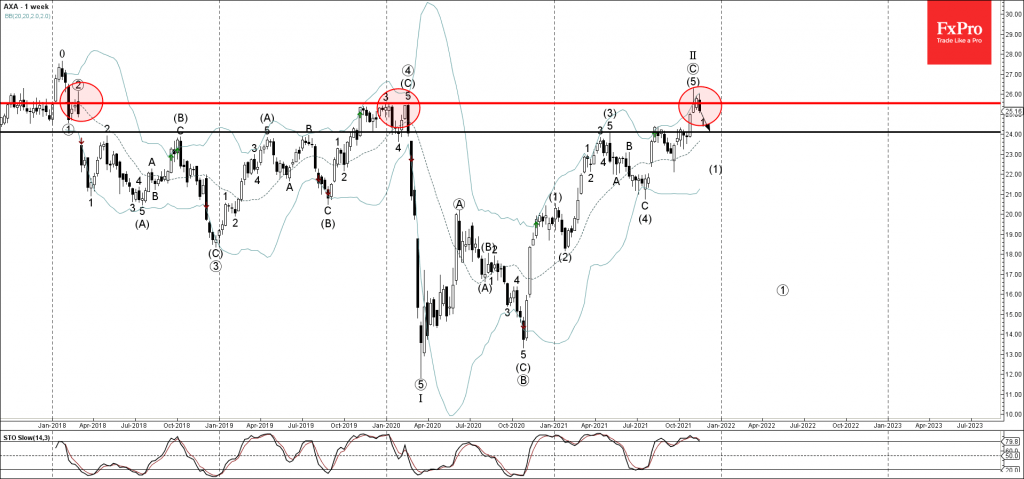
• AXA reversed from resistance area
• Likely to fall to support level 24.00
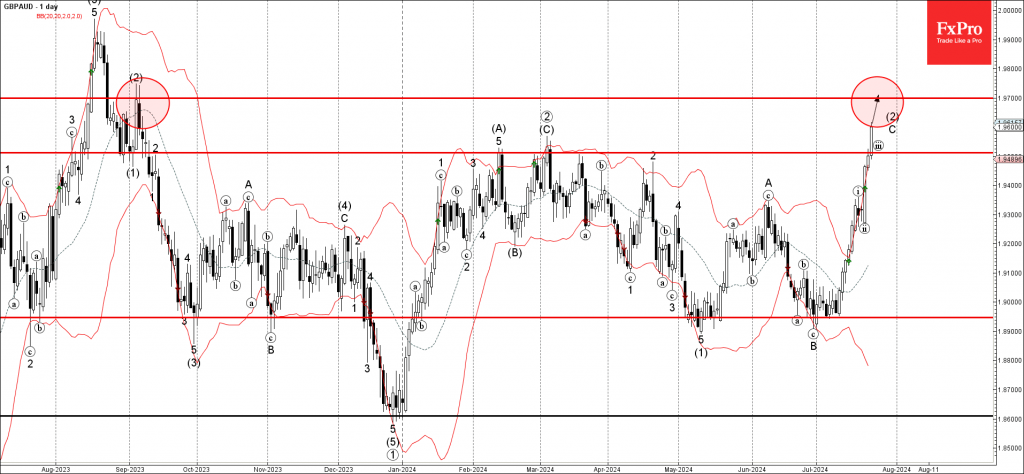
AXA recently reversed down from the resistance area located between the long-term resistance level 25.50 (which has been reversing the price from the start of 2018) and the upper weekly Bollinger Band.
The downward reversal from this resistance area started the active downward impulse waves 1 and (1).
Given the strength of the aforementioned resistance area and the overbought weekly Stochastic, oversold weekly Stochastic, AXA can be expected to fall further toward the next support level 24.00.
