Categories: Technical analysis

3M Wave Analysis 18 November, 2020

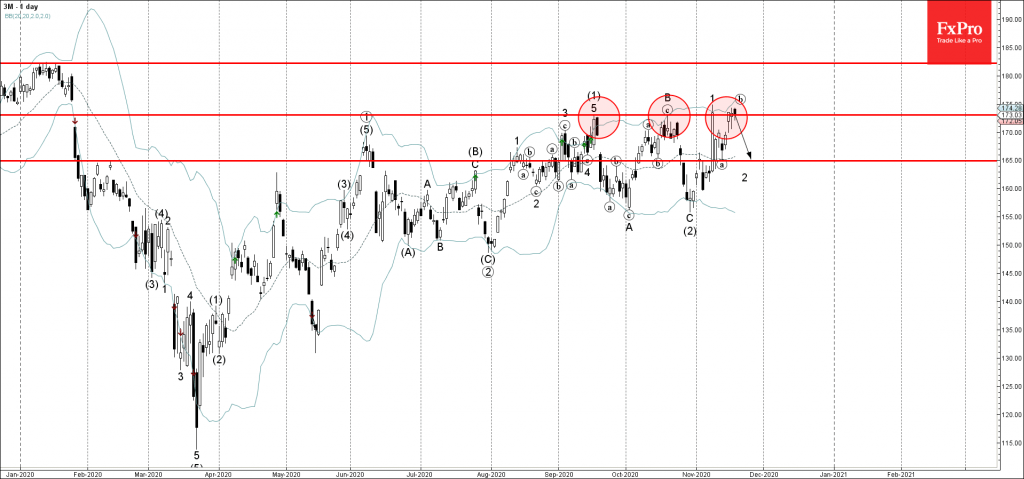
• 3M reversed from resistance level 173.00

• Likely to fall to 165.00

3M today reversed down from the strong resistance level 173.00 (which has been reversing the price from the middle of September) – intersecting with both the upper daily Bollinger Band and the upper weekly Bollinger Band.

The downward reversal from the resistance level 173.00 started the active short-term impulse wave (c) – which is a part of the ABC correction 2 from October.

3M is likely to fall further toward the next support level 165.00 (which is the bottom of the previous minor correction (a)).

The FxPro Tech Analysis Team

The FxPro technical experts prepare a daily analysis of the most active currency pairs (majors, crosses, exotics) and commodities. Selected instruments are reviewed on daily trends (D1, H4), using the active Elliott Wave setups, Japanese candlesticks, indicators, and support/resistance levels.

Share
Published by
The FxPro Tech Analysis Team
Tags: 3m

Recent Posts

ANF Wave Analysis 29 April 2024

ANF reversed from key support level 113.40 Likely to rise to resistance level 132.31 ANF…

50 mins ago

GBPUSD Wave Analysis 29 April 2024

- GBPUSD rising inside minor correction 2 - Likely to rise to resistance level 1.2700…

52 mins ago

Crypto Market Retreats Due to Overhang of Sellers

Market picture The crypto market has lost 3.3% in the last 24 hours to $2.3…

11 hours ago

USDJPY Wave Analysis 26 April 2024

- USDJPY broke key resistance level 155.00 - Likely to rise to resistance level 160.00…

3 days ago

Ebay Wave Analysis 26 April 2024

- Ebay reversed from support level 49.35 - Likely to rise to resistance level 52.55…

3 days ago

False Alert with Yen Interventions?

Even though the Bank of Japan left the key rate and parameters of the QE…

3 days ago

This website uses cookies