

Technical analysis
WTI Wave Analysis – 31 December , 2018
December 31, 2018 @ 13:48 +03:00

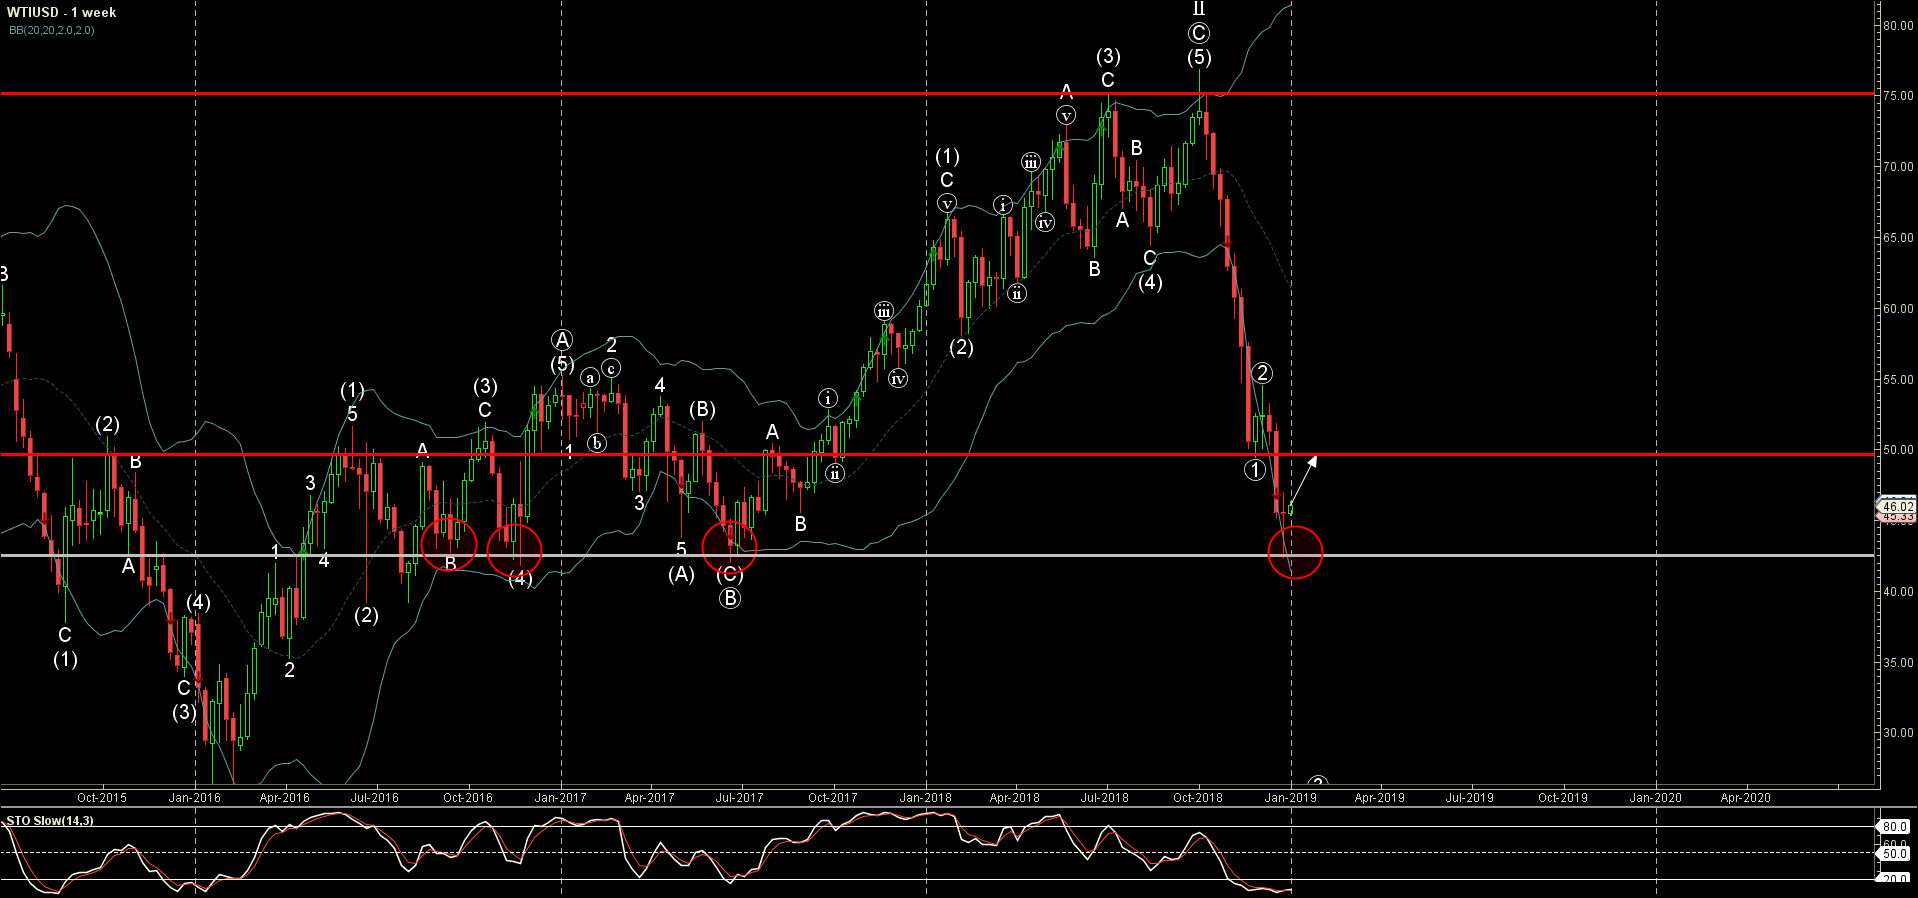
- WTI reversed from support area
- Further gains are likely
WTI continues to rise after the earlier upward reversal from the support area lying between the long-term support level 42.50 (which has been reversing the price from the end of October) and the lower weekly Bollinger Band.
The previous upward reversal from this support area created the weekly Japanese candlesticks reversal pattern Hammer Doji.
Given the oversold reading on the weekly Stochastic indicator – WTI is expected to rise further and re-test the next round resistance level 50.00 (former support from November).
Related Articles

WTI crude oil Wave Analysis 23 April 2024
April 23, 2024 @ 22:47 +03:00

USDCAD Wave Analysis 23 April 2024
April 23, 2024 @ 22:46 +03:00

Intel Wave Analysis 19 April 2024
April 19, 2024 @ 22:12 +03:00

GBPUSD Wave Analysis 19 April 2024
April 19, 2024 @ 22:11 +03:00