

Technical analysis
WTI Wave Analysis – 01 April, 2019
April 01, 2019 @ 18:47 +03:00

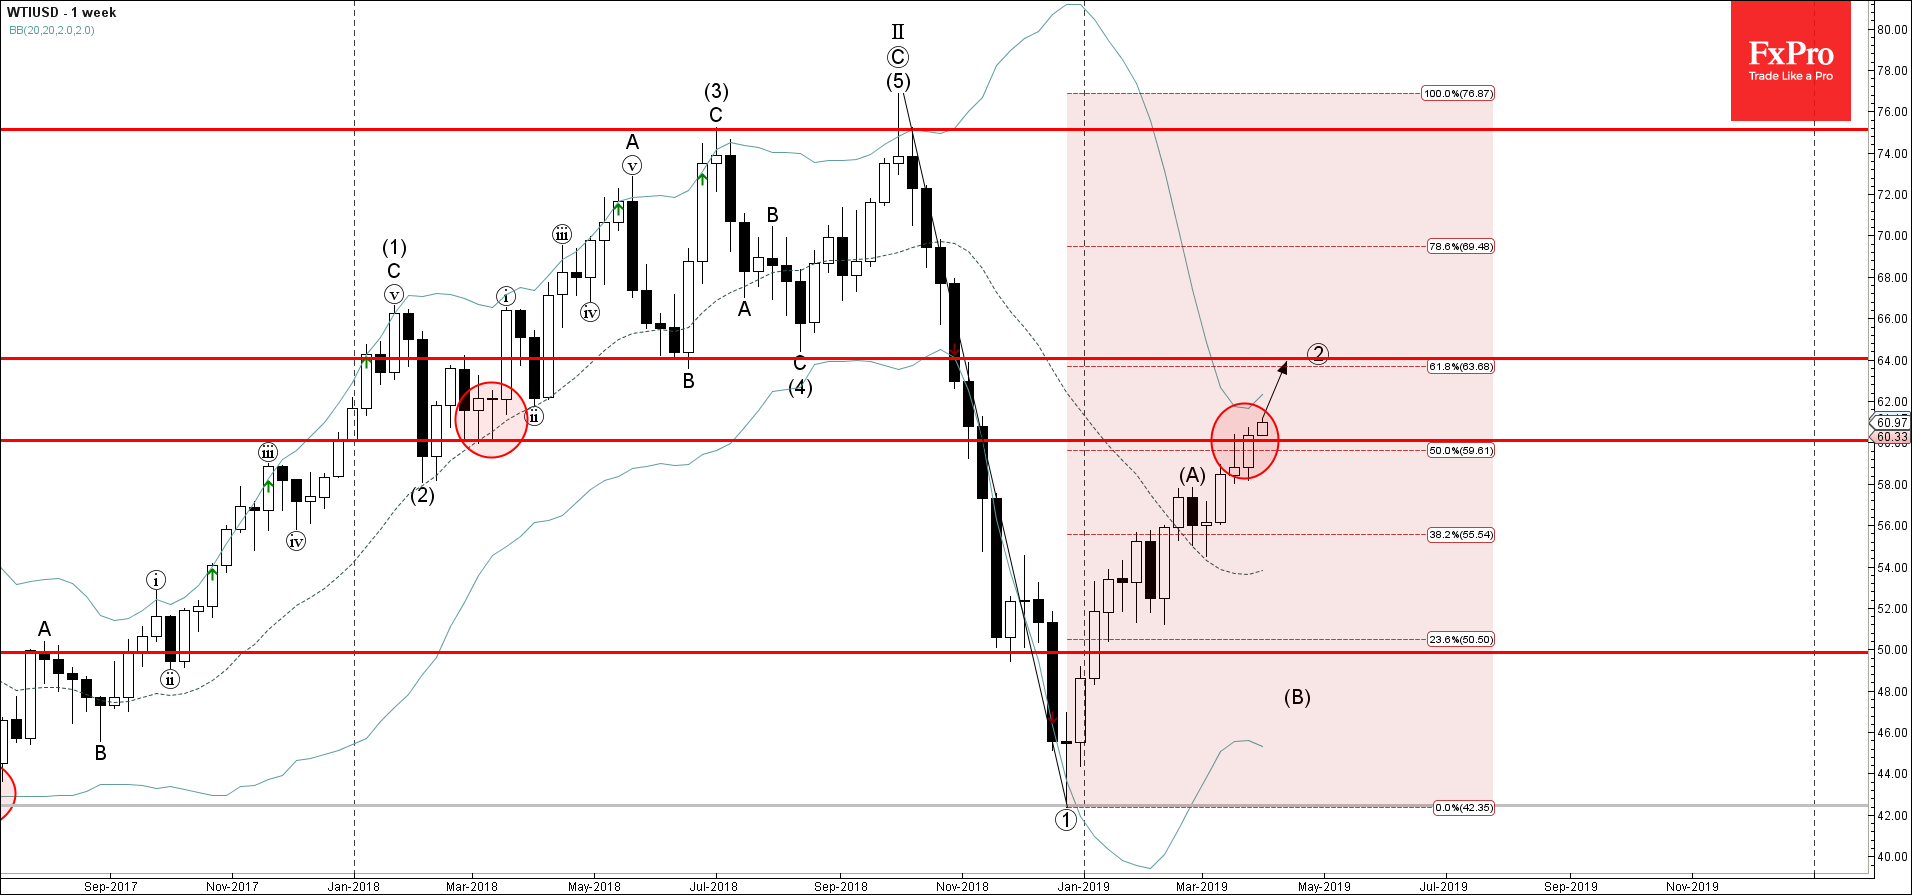
- WTI broke resistance area
- Further gains are likely
WTI continues to rise after the earlier breakout of the resistance area lying between the round resistance level 60.00 and the 50% Fibonacci correction of the previous sharp weekly downward impulse wave from last September.
The breakout of this resistance area should accelerate the active medium-term ABC correction ② from December.
WTI is expected to rise further and re-test the next resistance level 64.00 (target price for the completion of the active ABC correction ②).
Related Articles

GBPCAD Wave Analysis 25 April 2024
April 25, 2024 @ 20:10 +03:00

GBPAUD Wave Analysis 25 April 2024
April 25, 2024 @ 20:09 +03:00

EURGBP Wave Analysis 24 April 2024
April 24, 2024 @ 21:42 +03:00

EURJPY Wave Analysis 24 April 2024
April 24, 2024 @ 21:40 +03:00