

Technical analysis
WTI falling inside medium-term impulse wave (C)
October 16, 2018 @ 16:05 +03:00
- WTI falling inside medium-term impulse wave (C)
- Further losses are likely
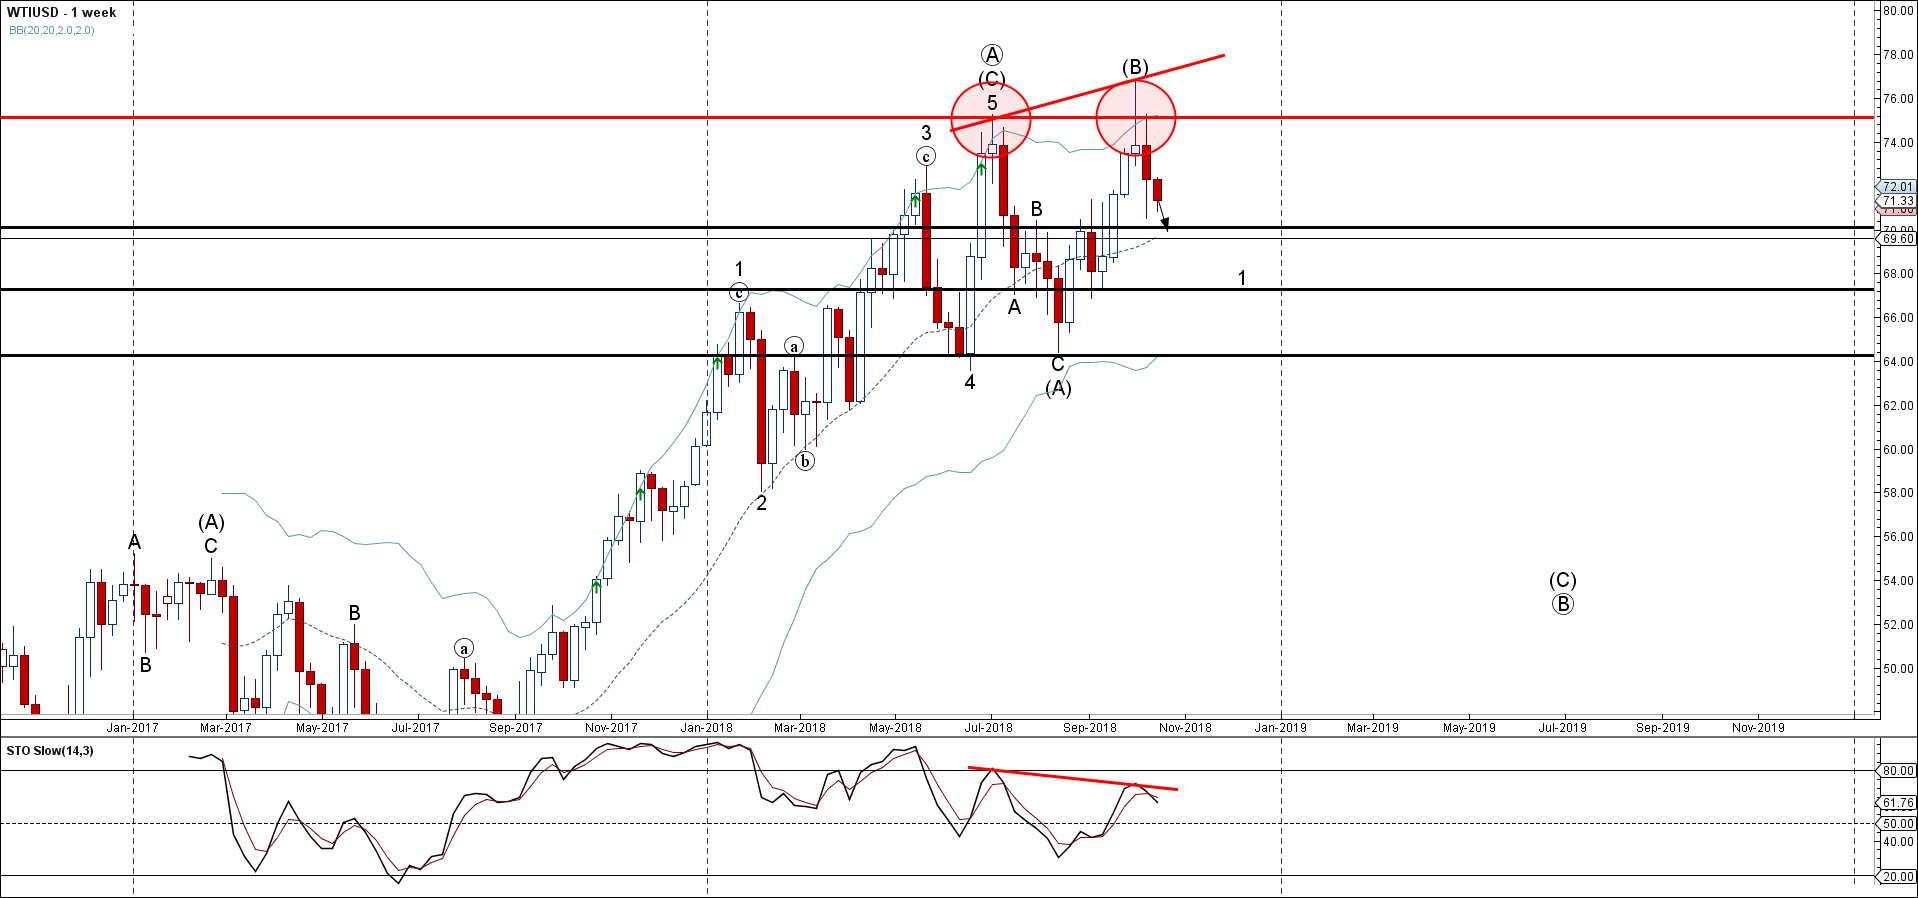
WTI has been falling in the last few trading sessions inside the medium-term impulse wave (C), which started earlier from the resistance area lying between the strong resistance level 75.10 (which also reversed the price in July) and the upper weekly Bollinger Band.
The downward reversal from this resistance area created the strong weekly Japanese candlestick reversal pattern Shooting Star Doji, highlighted below.
Given the clear bearish divergence on the weekly Stochastic indicator – WTI is expected to fall further and re-test the next round support level 70.00.
Related Articles

USDJPY Wave Analysis 26 April 2024
April 27, 2024 @ 00:00 +03:00

Ebay Wave Analysis 26 April 2024
April 26, 2024 @ 23:59 +03:00

GBPCAD Wave Analysis 25 April 2024
April 25, 2024 @ 20:10 +03:00

GBPAUD Wave Analysis 25 April 2024
April 25, 2024 @ 20:09 +03:00