

Technical analysis
Wheat Wave Analysis – 21 February, 2019
February 21, 2019 @ 17:16 +03:00

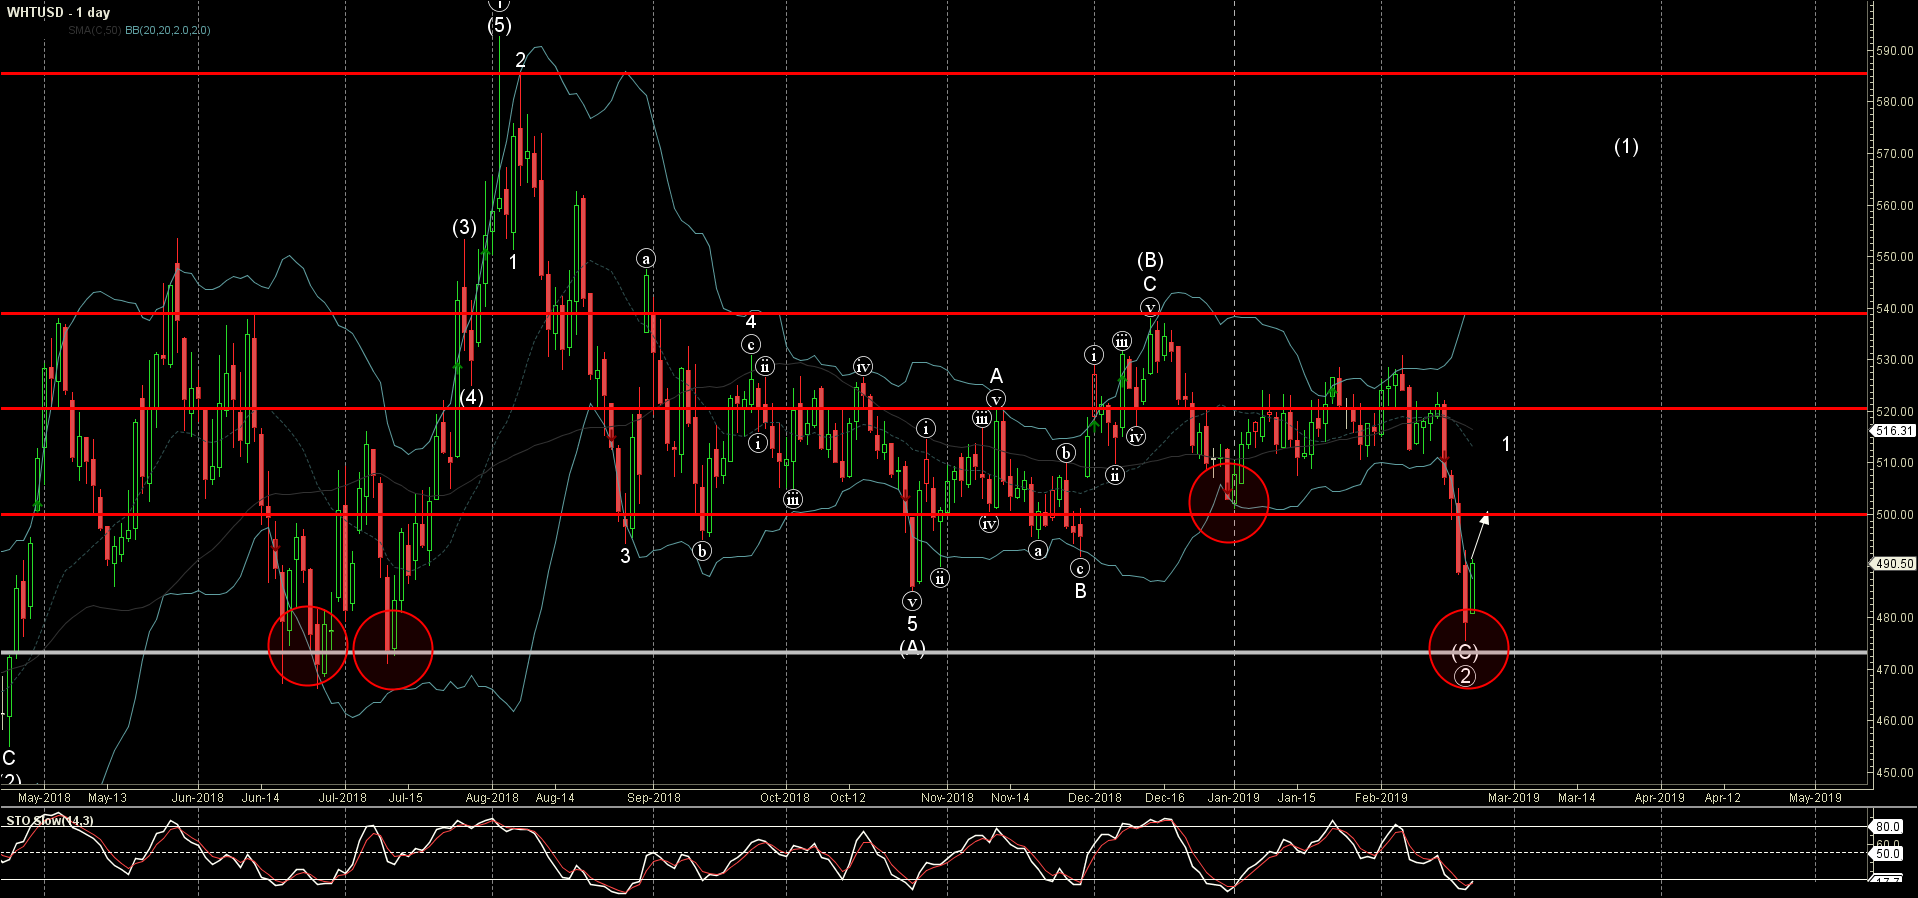
- Wheat reversed from support area
- Further gains are likely
Wheat today reversed up from the support area lying between the key long-term support level 473.00 (which has been reversing the price from the middle of last year, as can be seen below) and the lower daily Bollinger Band.
The upward reversal from this support area created the daily Japanese candlesticks reversal pattern Bullish Engulfing.
Wheat is expected to rise further and re-test the next round resistance level 500.00 (former support from last December).
Related Articles

GBPCAD Wave Analysis 25 April 2024
April 25, 2024 @ 20:10 +03:00

GBPAUD Wave Analysis 25 April 2024
April 25, 2024 @ 20:09 +03:00

EURGBP Wave Analysis 24 April 2024
April 24, 2024 @ 21:42 +03:00

EURJPY Wave Analysis 24 April 2024
April 24, 2024 @ 21:40 +03:00