

Wheat Wave Analysis – 05 February, 2020
February 05, 2020 @ 17:26 +03:00

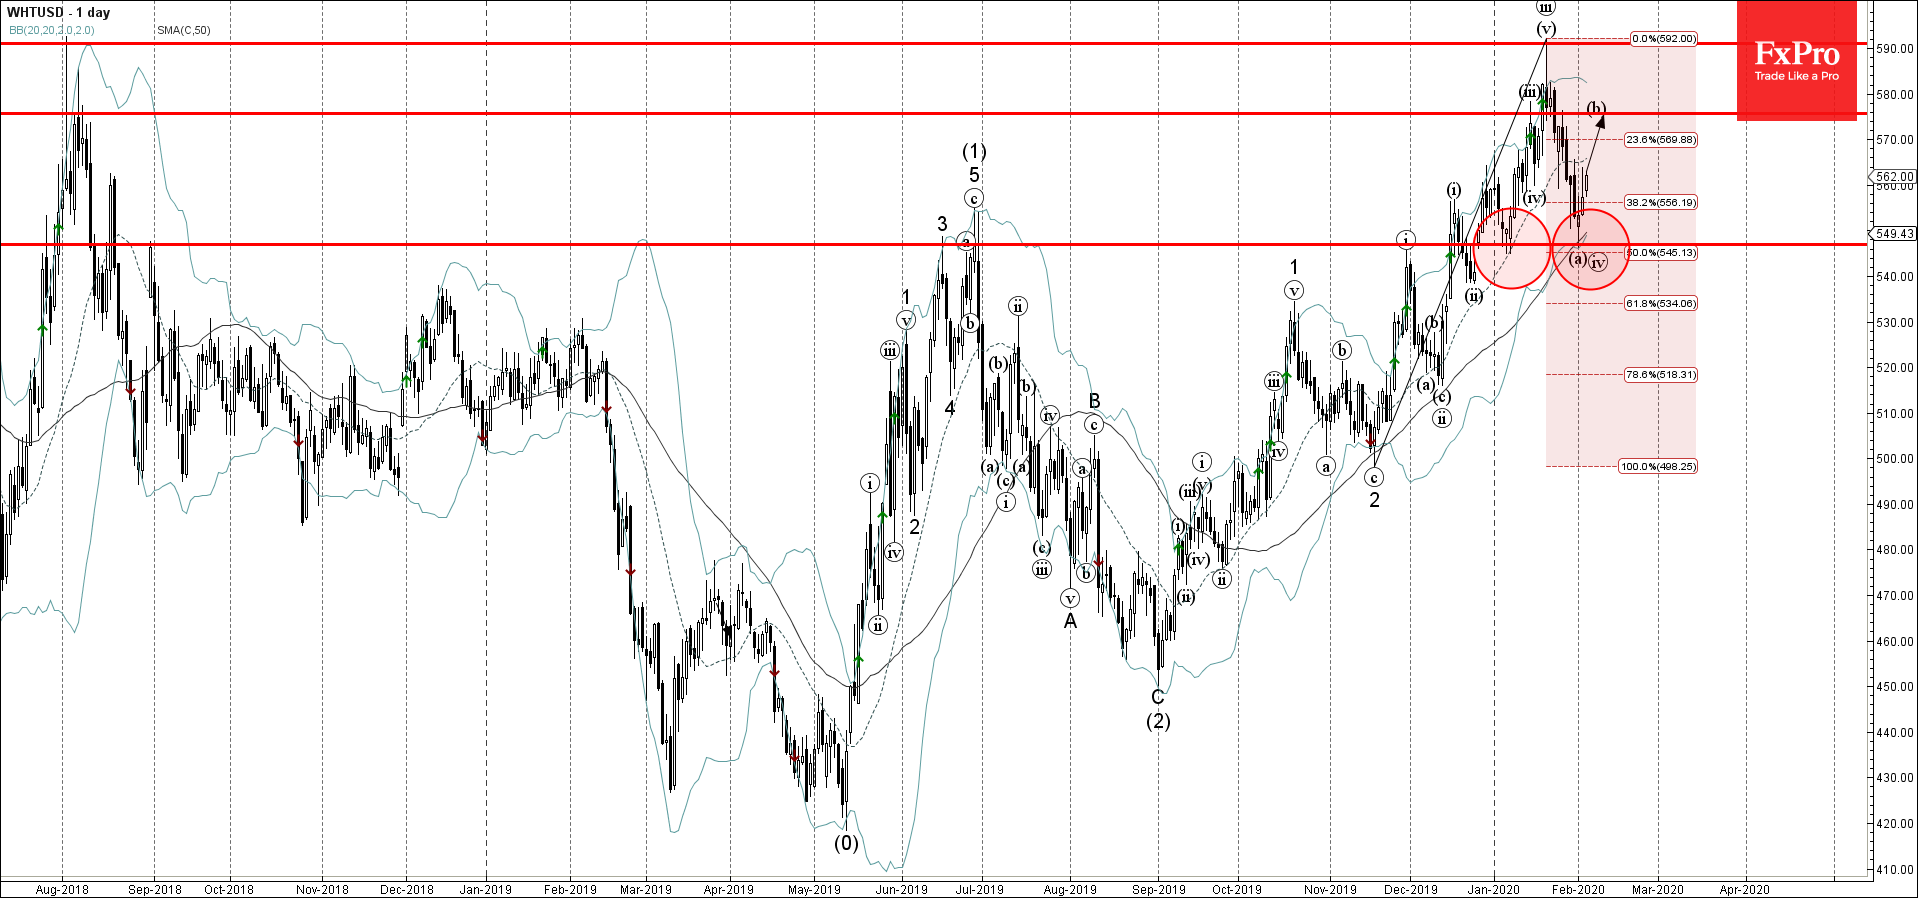
- Wheat reversed from support zone
- Likely to rise to 575.00
Wheat recently reversed up with the daily hammer from the support area, lying between the key support level 547.00 (the bottom of the previous correction from the beginning of January), lower daily Bollinger band and the 50% Fibonacci correction of the previous sharp upward impulse wave from November.
The upward reversal from this support area has started the active short-term corrective wave (b).
Given the strength of the uptrend visible on daily wheat charts, the price is likely to continue to rise toward the next resistance level of 575.00 (target price for the completion of the active wave (b)).

April 18, 2024 @ 23:09 +03:00

April 18, 2024 @ 23:08 +03:00

April 17, 2024 @ 22:40 +03:00

April 17, 2024 @ 22:38 +03:00