

Technical analysis
USDCHF Wave Analysis – 30 January, 2020
January 30, 2020 @ 16:46 +03:00

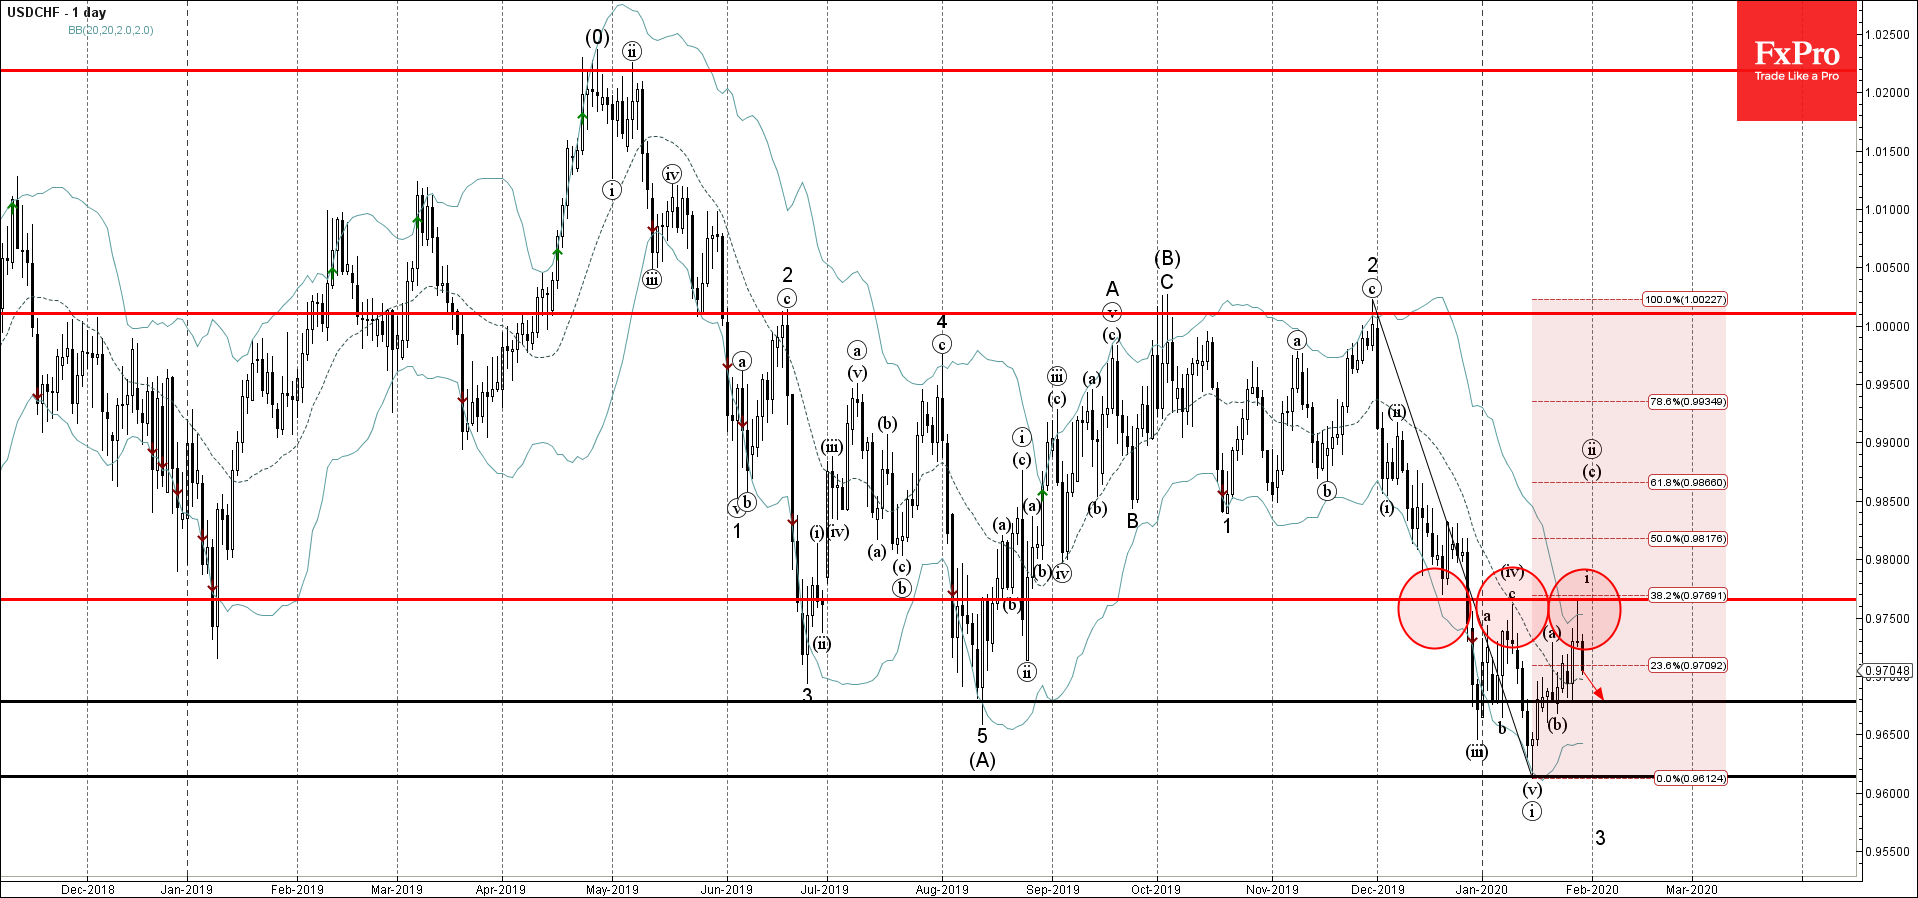
- USDCHF reversed from resistance area
- Likely to fall to 0.9670
USDCHF recently reversed down sharply from the resistance area lying between the resistance level 0.9765, upper daily Bollinger Band and the 38.2% Fibonacci correction of the earlier sharp downward impulse from November.
The downward reversal from this resistance area created the daily Japanese candlesticks reversal pattern Shooting Star.
USDCHF is likely to fall further toward the next support level 0.9670 (which stopped the earlier corrective wave (b)).
Related Articles

WTI Wave Analysis 17 April 2024
April 17, 2024 @ 22:40 +03:00

EURGBP Wave Analysis 17 April 2024
April 17, 2024 @ 22:38 +03:00

Citigroup Wave Analysis 16 April 2024
April 16, 2024 @ 22:06 +03:00

USDJPY Wave Analysis 16 April 2024
April 16, 2024 @ 22:05 +03:00