

Technical analysis
USDCHF Wave Analysis – 28 April, 2020
April 28, 2020 @ 17:47 +03:00

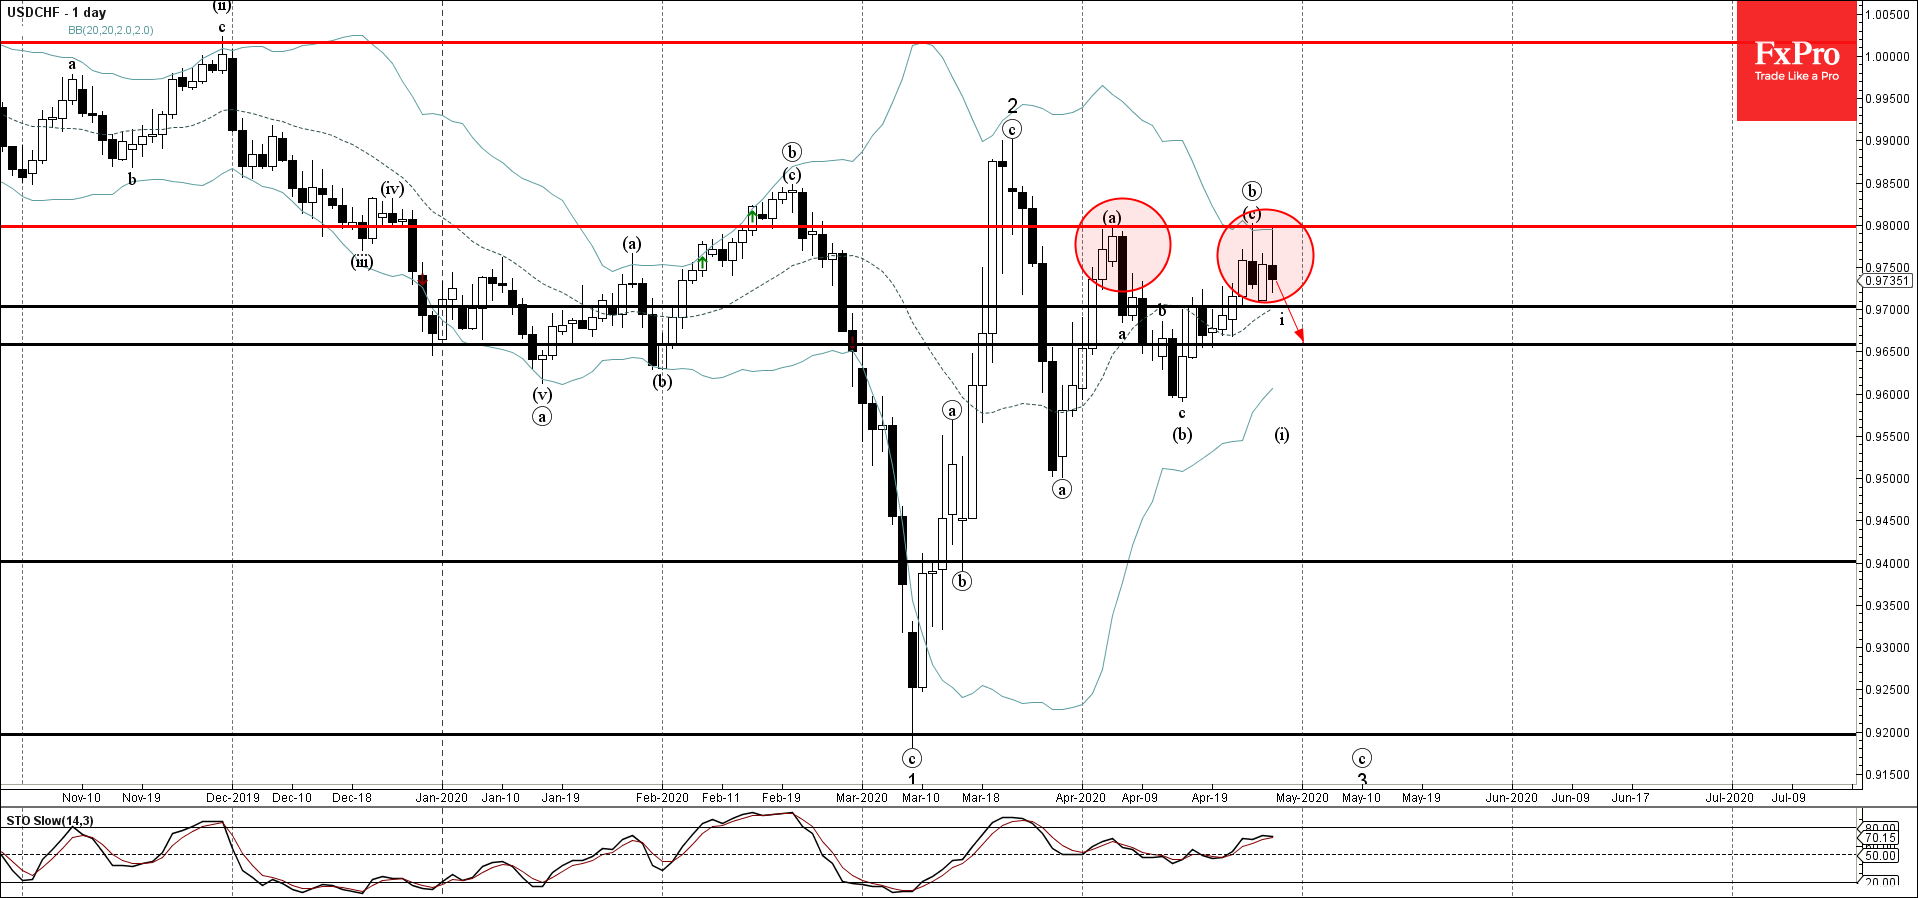
- USDCHF reversed from resistance level 0.9800
- Likely to fall to 0.9700
USDCHF recently reversed down sharply once again from the key resistance level 0.9800 – standing close to the upper daily Bollinger Band.
The downward reversal from the resistance level 0.9800 continues the active short-term impulse wave (c).
USDCHF is expected to fall further toward the next support level 0.9700 – the breakout of which can lead to further losses toward 0.9660.
Related Articles

EURGBP Wave Analysis 24 April 2024
April 24, 2024 @ 21:42 +03:00

EURJPY Wave Analysis 24 April 2024
April 24, 2024 @ 21:40 +03:00

WTI crude oil Wave Analysis 23 April 2024
April 23, 2024 @ 22:47 +03:00

USDCAD Wave Analysis 23 April 2024
April 23, 2024 @ 22:46 +03:00