

Technical analysis
USDCHF Wave Analysis – 23 April, 2020
April 23, 2020 @ 13:39 +03:00

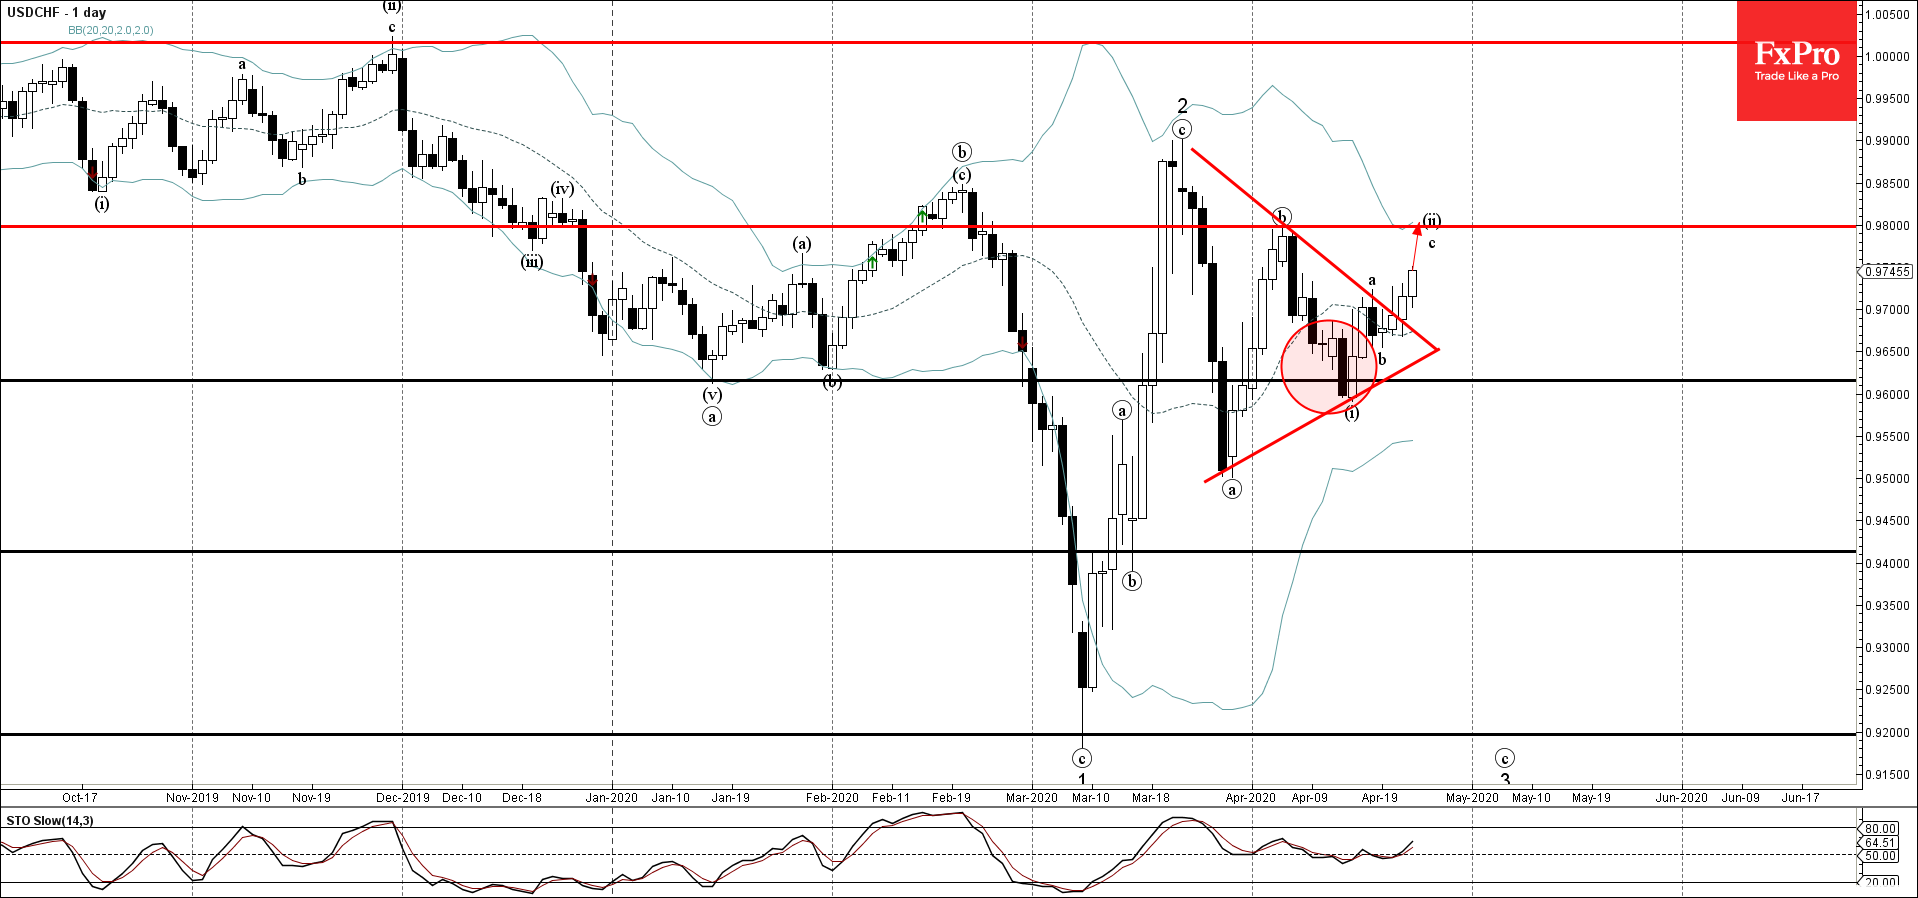
- USDCHF broke daily Triangle
- Likely to rise to 0.9800
USDCHF recently broke the resistance trendline of the daily Triangle from the end of March (which encloses waves (a) and (b) of the active ABC correction (ii)).
The breakout of the Triangle coincided with the breakout of the resistance level 0.9700 (which stopped the a sub-wave of the active minor wave ii).
USDCHF is expected to rise further toward the next resistance level 0.9800 (top of the previous wave (b) and the target for the completion of wave ii).
Related Articles

EURGBP Wave Analysis 24 April 2024
April 24, 2024 @ 21:42 +03:00

EURJPY Wave Analysis 24 April 2024
April 24, 2024 @ 21:40 +03:00

WTI crude oil Wave Analysis 23 April 2024
April 23, 2024 @ 22:47 +03:00

USDCAD Wave Analysis 23 April 2024
April 23, 2024 @ 22:46 +03:00