

Technical analysis
USDCHF Wave Analysis – 20 May, 2020
May 20, 2020 @ 17:32 +03:00

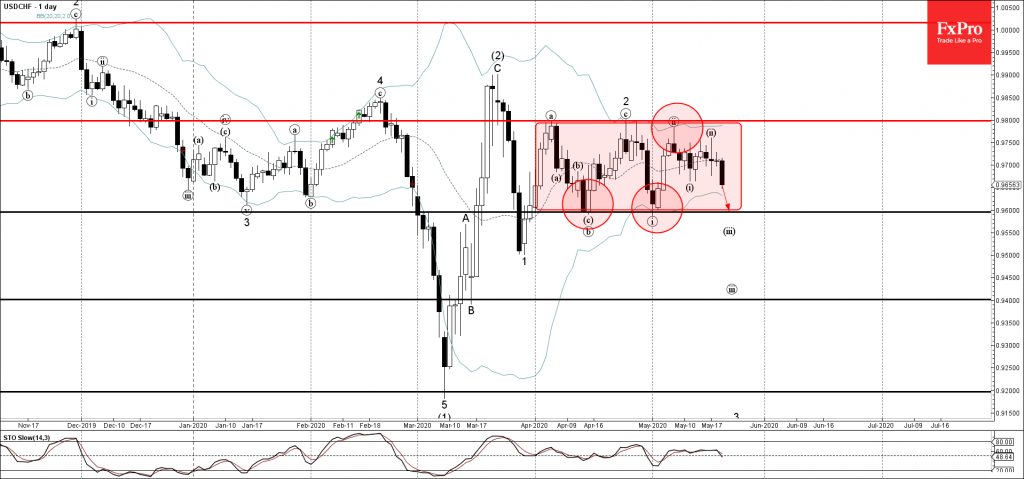
• USDCHF falling inside sideways price range
• Likely to fall to 0.9600
USDCHF recently reversed down from the resistance zone lying between the pivotal resistance level 0.9800 (upper boundary of the sideways price range from the start of April) and the upper daily Bollinger Band.
The downward reversal from this resistance zone started the active short-term impulse wave (iii) – which belongs to the higher level impulse waves 3 and (3). USDCHF is likely to fall further toward the next support level 0.9600 (low of this sideways price range).
Related Articles

Intel Wave Analysis 19 April 2024
April 19, 2024 @ 22:12 +03:00

GBPUSD Wave Analysis 19 April 2024
April 19, 2024 @ 22:11 +03:00

EURJPY Wave Analysis 18 April 2024
April 18, 2024 @ 23:09 +03:00

EURUSD Wave Analysis 18 April 2024
April 18, 2024 @ 23:08 +03:00