

Technical analysis
USDCHF Wave Analysis – 20 January, 2020
January 20, 2020 @ 16:20 +03:00

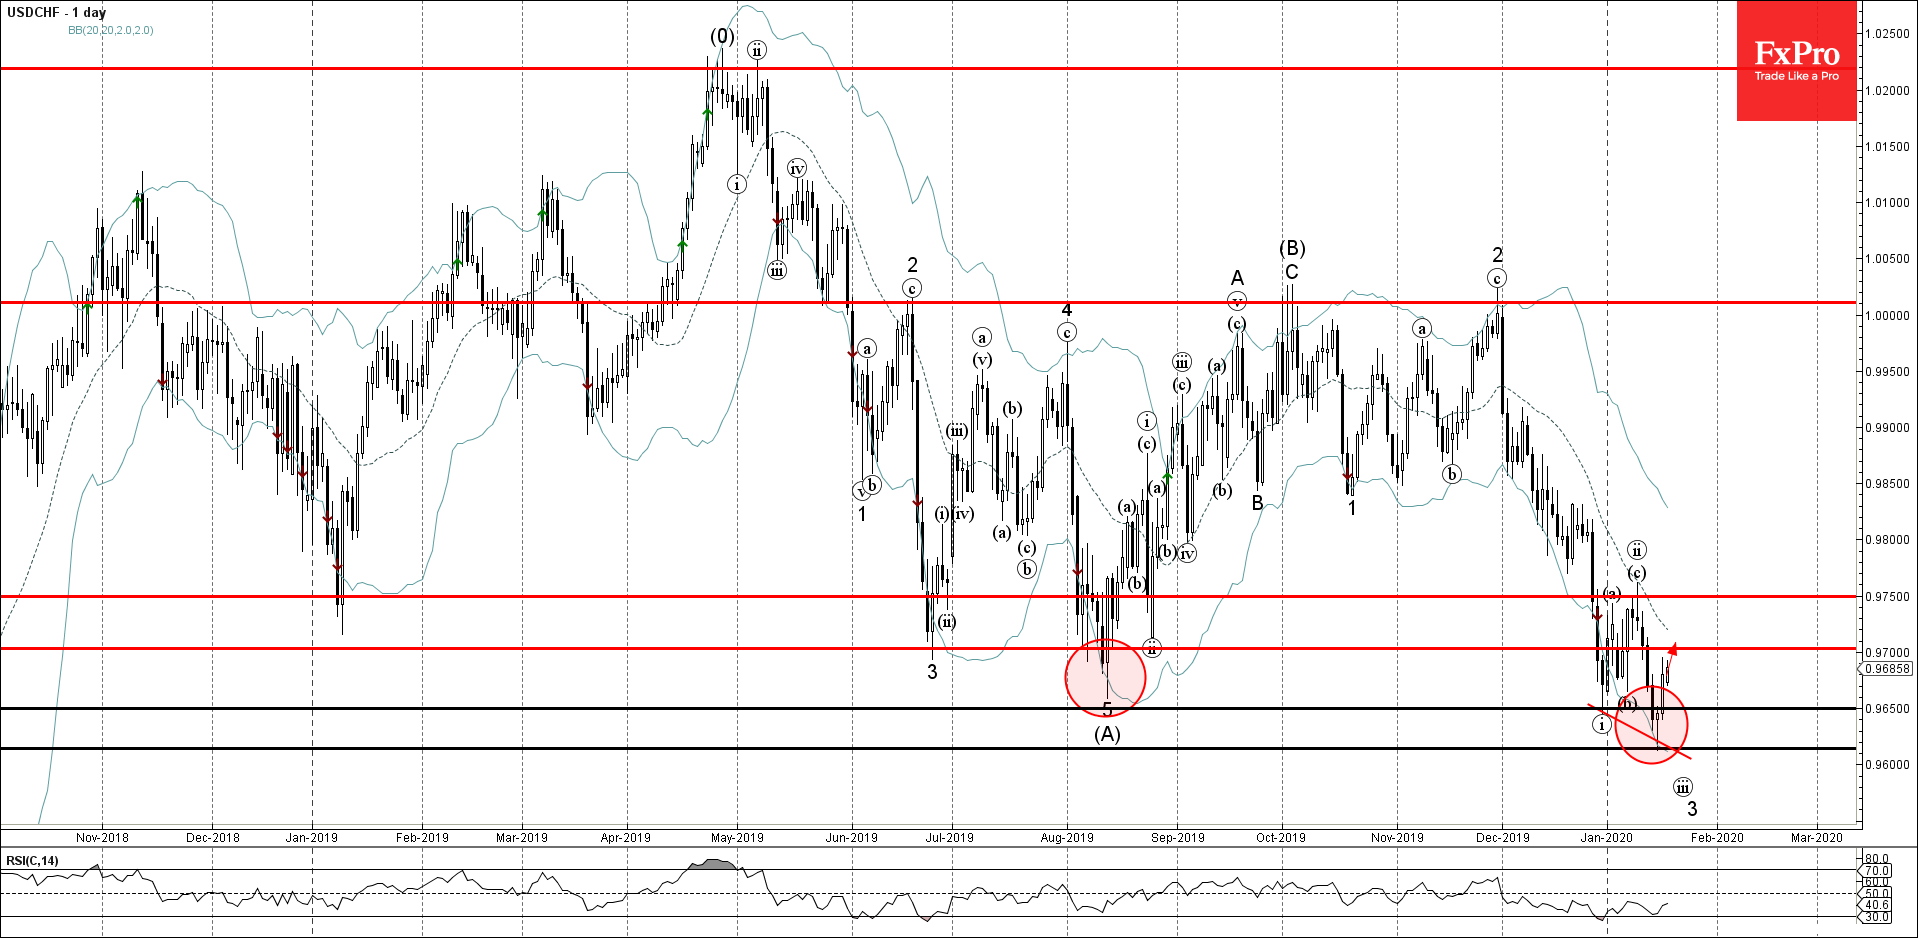
- USDCHF reversed from support area
- Likely to rise to 0.9700
USDCHF recently reversed up from the support area lying between the key support level 0.9650 (which has been reversing the price from August), support level 0.9650 and the lower daily Bollinger Band.
The upward reversal from this support area created the daily Japanese candlesticks reversal pattern Morning Star – with the Hammer in the middle.
With the clear bullish divergence visible on the daily Stochastic indicator – USDCHF is likely to rise further toward the next resistance level 0.9700.
Related Articles

Intel Wave Analysis 19 April 2024
April 19, 2024 @ 22:12 +03:00

GBPUSD Wave Analysis 19 April 2024
April 19, 2024 @ 22:11 +03:00

EURJPY Wave Analysis 18 April 2024
April 18, 2024 @ 23:09 +03:00

EURUSD Wave Analysis 18 April 2024
April 18, 2024 @ 23:08 +03:00