

Technical analysis
USDCAD Wave Analysis – 17 March, 2020
March 17, 2020 @ 17:38 +03:00

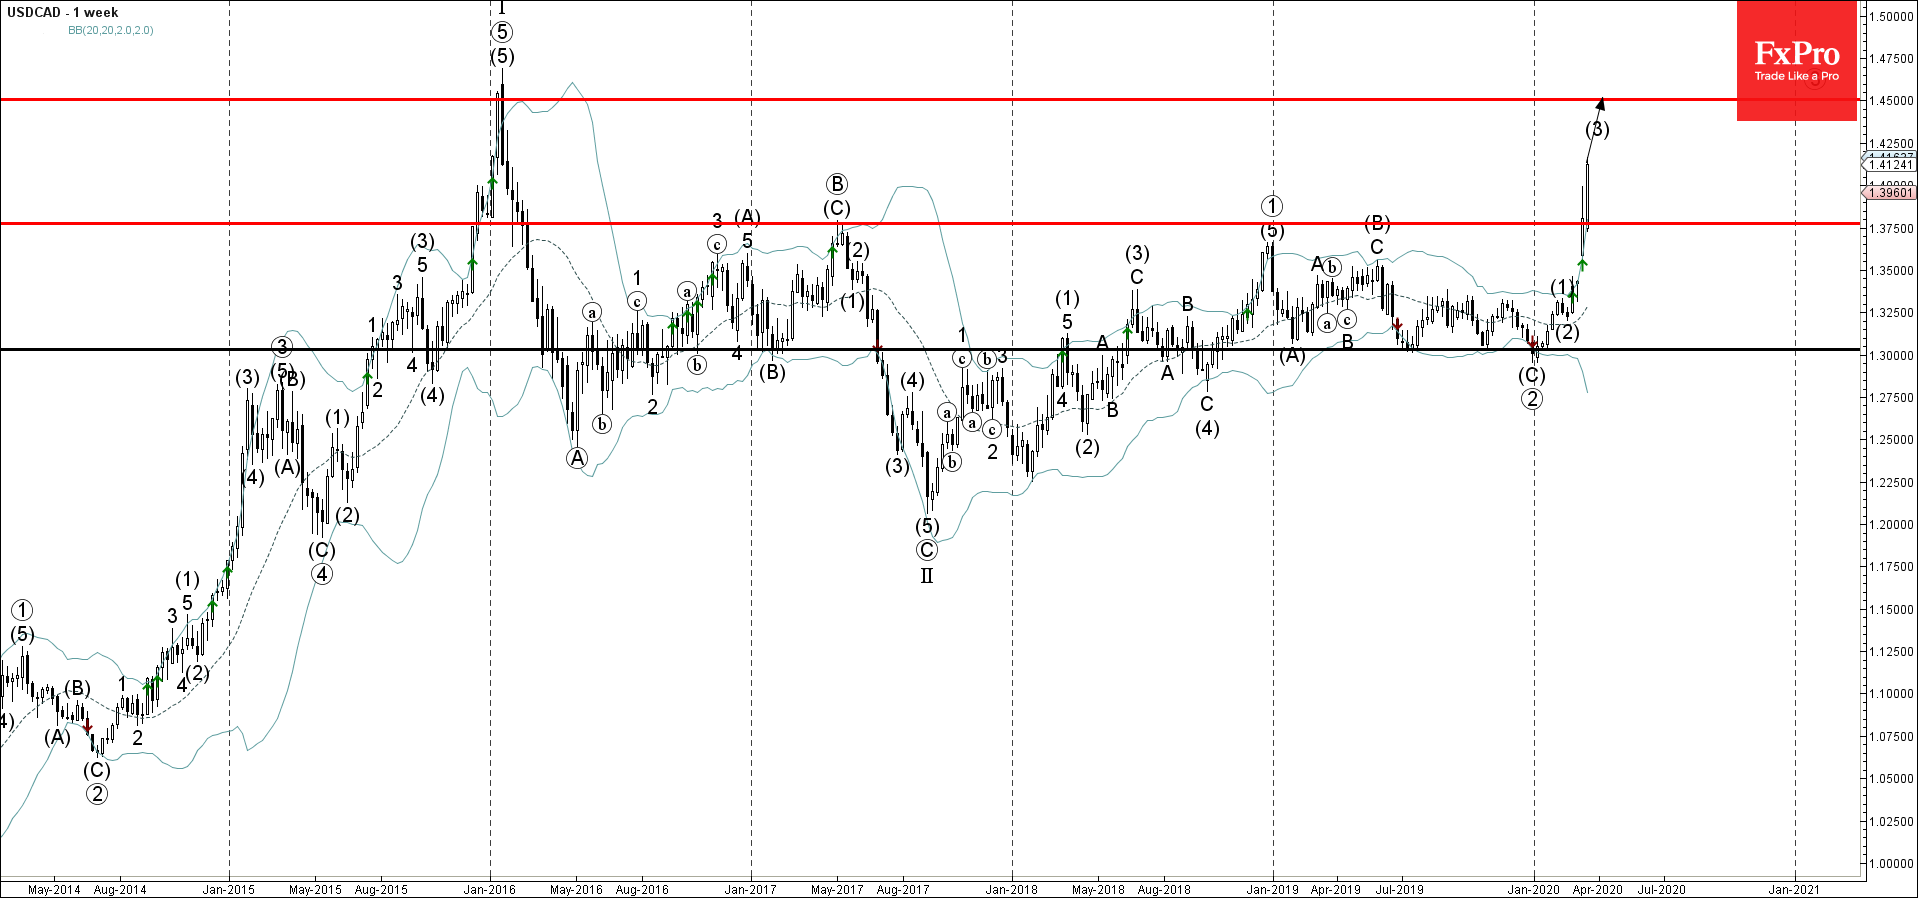
- USDCAD broke multi-month resistance level 1.3750
- Likely to rise to 1.4500
USDCAD recently broke the key multi-month resistance level 1.3750 (which previously stopped the daily uptrend at the start of 2017 as can be seen from the weekly USDCAD chart below).
The breakout of the resistance level 1.3750 accelerated the active medium-term upward impulse wave (3) from the start of this year.
USDCAD is likely to rise further toward the next resistance level 1.4500 (which stopped the sharp weekly uptrend in 2016 and which is also the target price for the completion of the active impulse wave (3
Related Articles

Intel Wave Analysis 19 April 2024
April 19, 2024 @ 22:12 +03:00

GBPUSD Wave Analysis 19 April 2024
April 19, 2024 @ 22:11 +03:00

EURJPY Wave Analysis 18 April 2024
April 18, 2024 @ 23:09 +03:00

EURUSD Wave Analysis 18 April 2024
April 18, 2024 @ 23:08 +03:00