

Technical analysis
USDCAD Wave Analysis 02 November, 2020
November 02, 2020 @ 18:28 +03:00

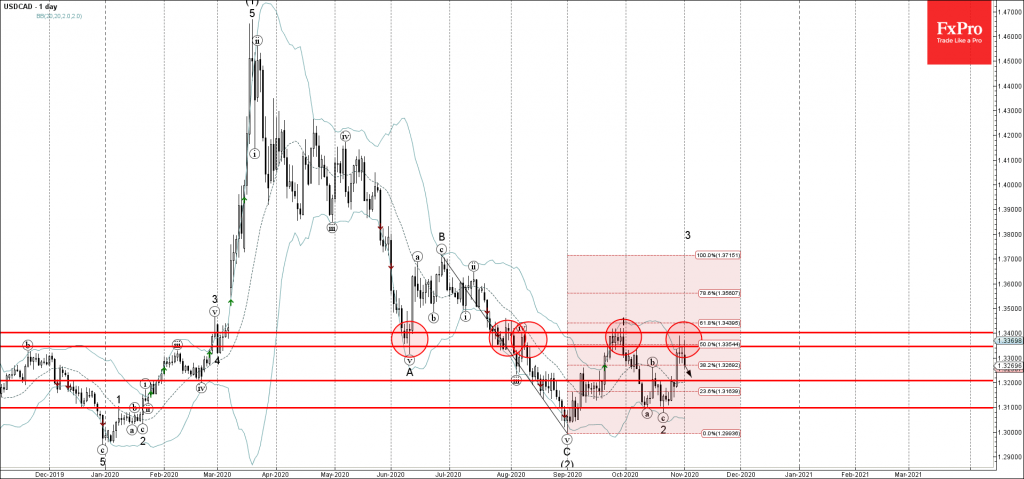
• USDCAD reversed from resistance zone
• Likely to fall to 1.3200
USDCAD continues to fall after the earlier downward reversal from the resistance zone lying between the resistance levels 1.3400, 1.3345, upper daily Bollinger Band and the 50% Fibonacci correction of the downward impulse C from June.
The downward reversal from this resistance zone stopped the earlier upward impulse waves 3 and (3).
USDCAD is likely to fall further toward the next support level 1.3200 (former resistance from the middle of October).
Related Articles

GBPCAD Wave Analysis 25 April 2024
April 25, 2024 @ 20:10 +03:00

GBPAUD Wave Analysis 25 April 2024
April 25, 2024 @ 20:09 +03:00

EURGBP Wave Analysis 24 April 2024
April 24, 2024 @ 21:42 +03:00

EURJPY Wave Analysis 24 April 2024
April 24, 2024 @ 21:40 +03:00