

Technical analysis
Sugar Wave Analysis – 29 October , 2018
October 29, 2018 @ 20:15 +03:00
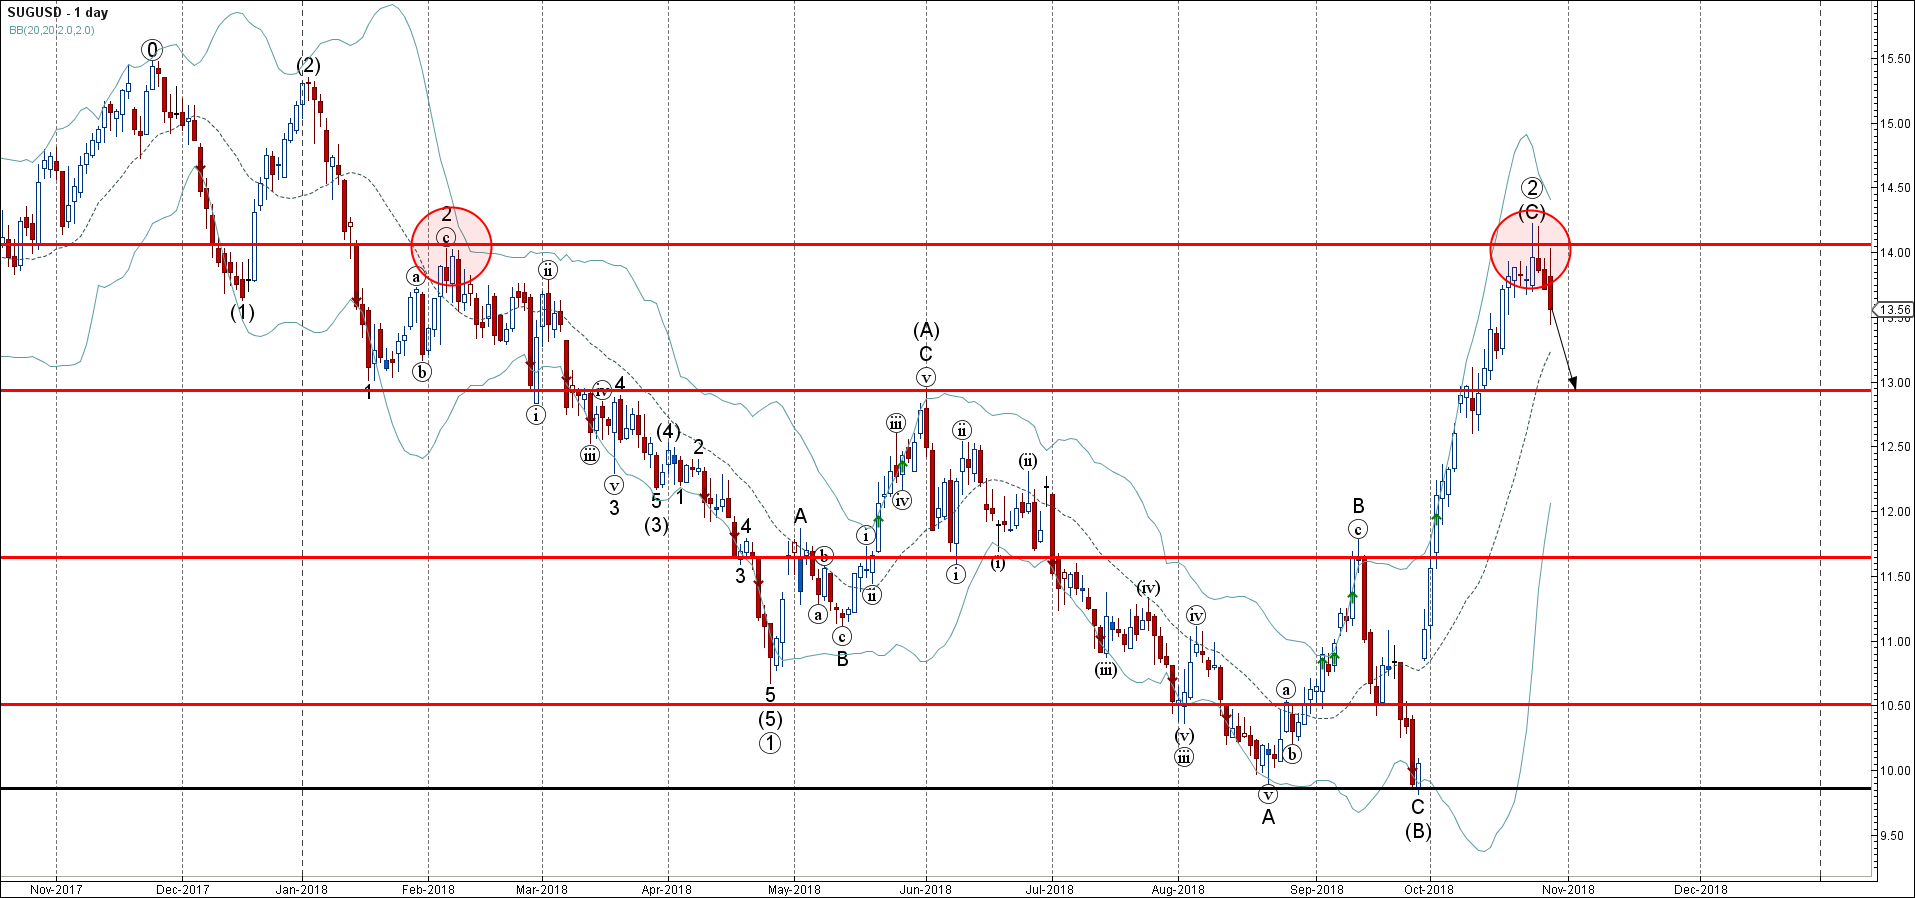
- Sugar reversed from key resistance area
- Further losses are likely
Sugar recently reversed down from the key resistance area lying at the intersection of the strong resistance level 14.00 (monthly high from February) and the upper daily Bollinger Band.
The downward reversal from this resistance area stopped the earlier medium-term impulse wave (C) – which belongs to the longer-term ABC correction ② from April.
Sugar is expected to fall further and re-test the next strong support level 13.00 (former strong resistance and the top of the previous correction (A) from May).
Related Articles

S&P 500 Wave Analysis 7 May 2024
May 07, 2024 @ 22:06 +03:00

USDCHF Wave Analysis 7 May 2024
May 07, 2024 @ 22:05 +03:00

USDJPY Wave Analysis 6 May 2024
May 06, 2024 @ 21:30 +03:00

Gold Wave Analysis 6 May 2024
May 06, 2024 @ 21:30 +03:00