

Technical analysis
Sugar Wave Analysis – 22 January, 2020
January 22, 2020 @ 16:38 +03:00

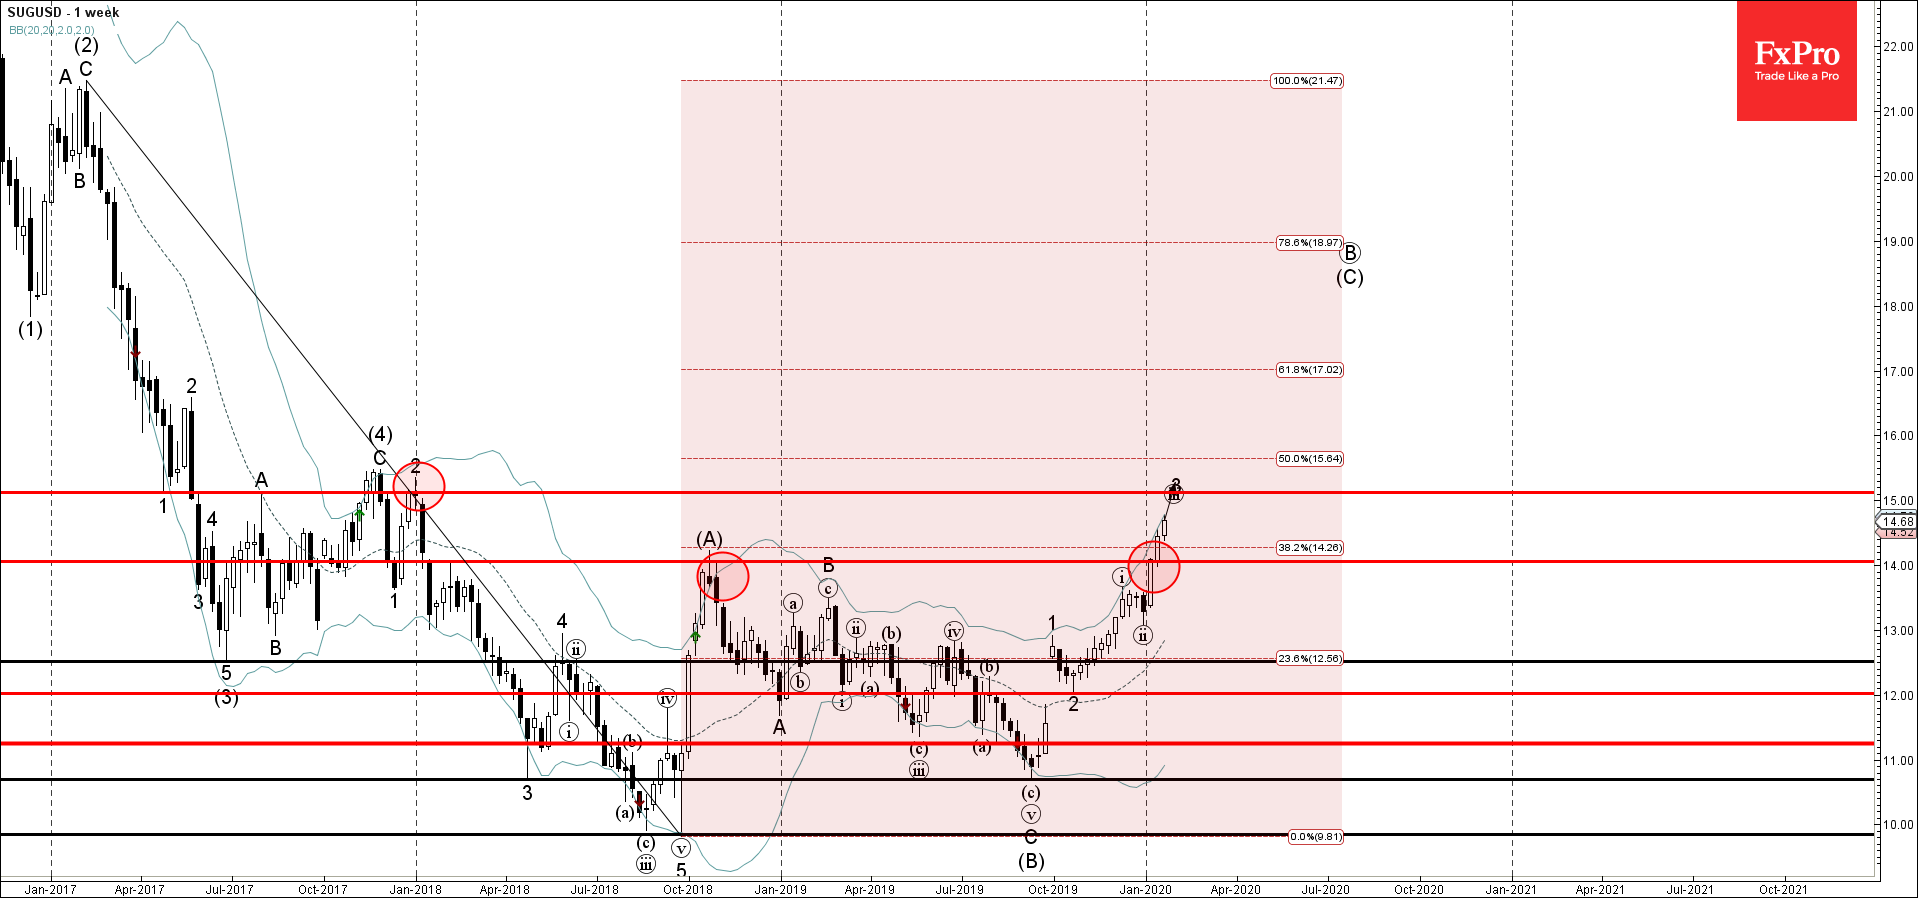
- Sugar broke resistance area
- Likely to rise to 15.00
Sugar has been under bullish pressure lately after the earlier breakout of resistance area lying between the resistance level 14.00 (former monthly high from October 2018) and the 38.2% Fibonacci correction of the previous weekly downtrend from 2017 to 2018.
The breakout of this resistance area accelerated the active short-term impulse wave 3, which belongs to the (C)-wave from last year.
Sugar is likely to rise further toward the next resistance level 15.00 (former resistance from 2017 and the forecast price for the completion of the active impulse wave 3).
Related Articles

EURGBP Wave Analysis 24 April 2024
April 24, 2024 @ 21:42 +03:00

EURJPY Wave Analysis 24 April 2024
April 24, 2024 @ 21:40 +03:00

WTI crude oil Wave Analysis 23 April 2024
April 23, 2024 @ 22:47 +03:00

USDCAD Wave Analysis 23 April 2024
April 23, 2024 @ 22:46 +03:00