

Technical analysis
Sugar Wave Analysis – 17 February, 2020
February 17, 2020 @ 17:51 +03:00

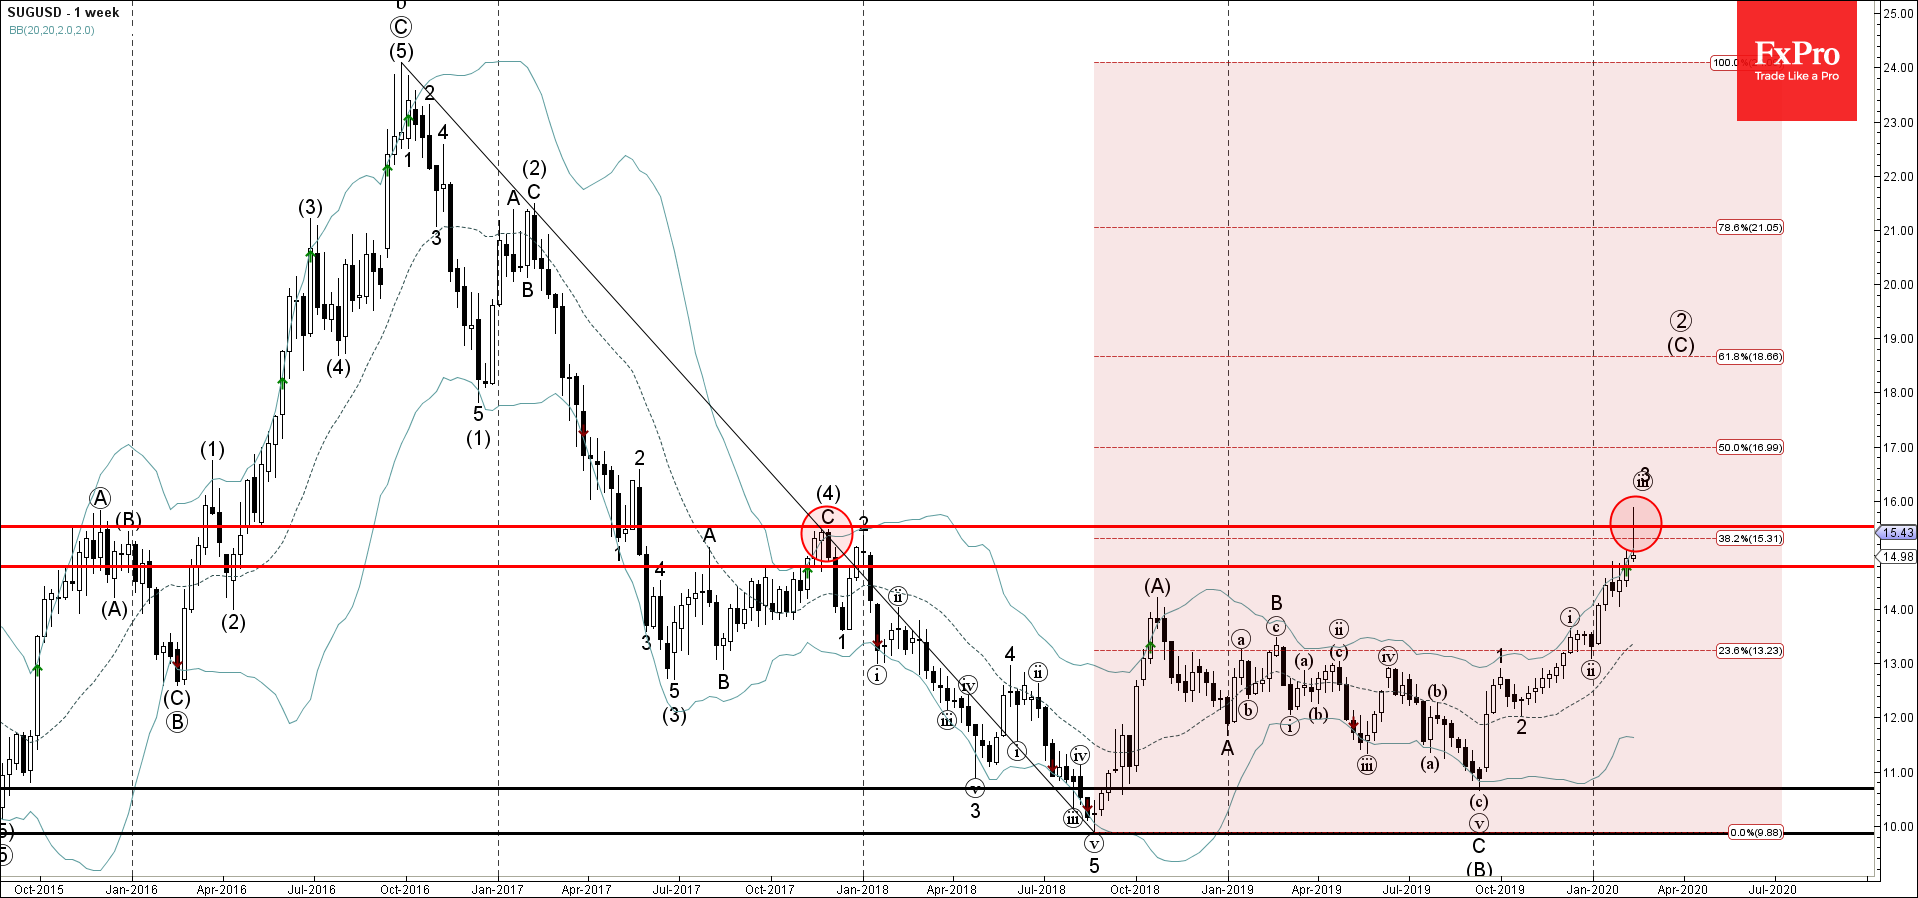
- Sugar reversed from resistance area
- Likely to fall to 15.00
Sugar previously reversed down sharply from the resistance area lying between the multi-year resistance level 15.50 (which stopped the price at the end of 2017), upper weekly Bollinger Band and the 38,2% Fibonacci retracement of the previous weekly downward impulse from July of 2016.
The downward reversal from this from the resistance area stopped the previous impulse waves 3 and (C).
Given the strength of the aforementioned resistance area – Sugar is likely to correct down further toward the next support level 15.00.
Related Articles

S&P 500 Wave Analysis 15 April 2024
April 16, 2024 @ 00:44 +03:00

EURUSD Wave Analysis 15 April 2024
April 16, 2024 @ 00:44 +03:00

USDCAD Wave Analysis 12 April 2024
April 12, 2024 @ 23:11 +03:00

GBPAUD Wave Analysis 12 April 2024
April 12, 2024 @ 23:10 +03:00