

Technical analysis
Sugar Wave Analysis – 10 May, 2019
May 10, 2019 @ 17:28 +03:00

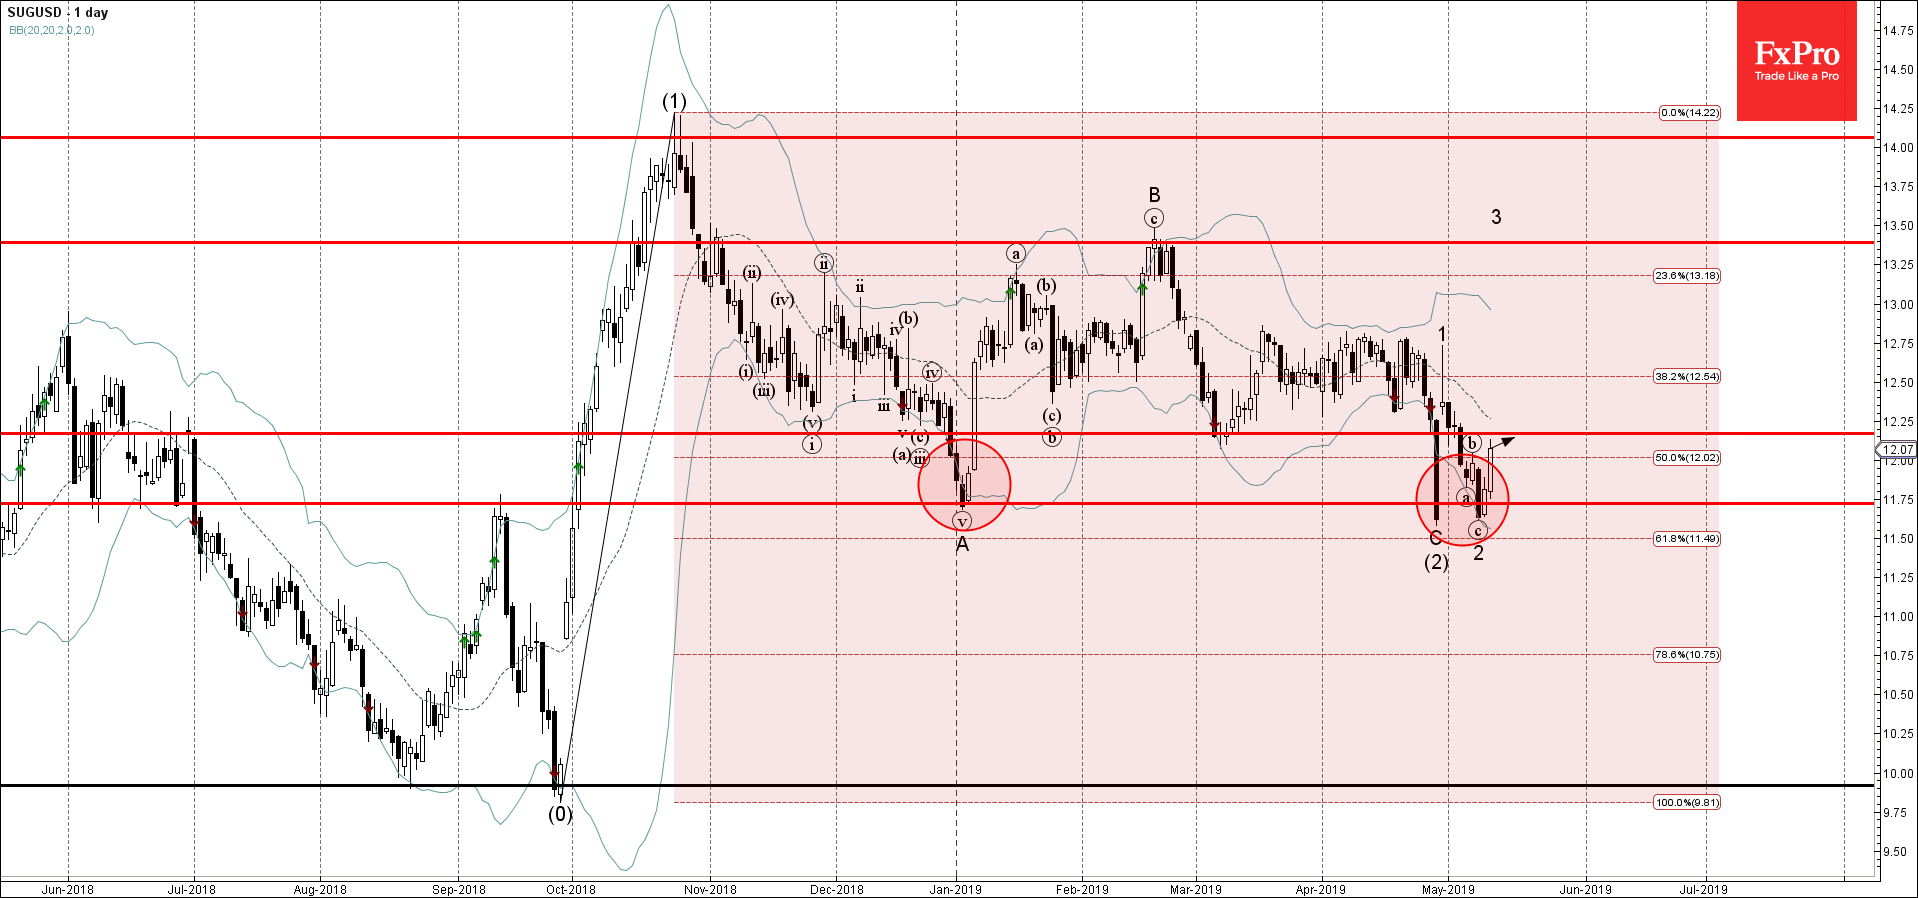
- Sugar reversed from support area
- Further gains are likely
Sugar recently reversed up from the key support area lying between the support level 11.75 (which has been reversing the price from January), lower daily Bollinger Band and the 61.8% Fibonacci correction of the previous upward impulse from last September.
The upward reversal from this support area completed the previous minor ABC correction 2 – which belongs to the impulse wave (3) from April.
Sugar is expected to rise further and retest the next resistance level 12.17 (former support level from March).
Related Articles

GBPCAD Wave Analysis 25 April 2024
April 25, 2024 @ 20:10 +03:00

GBPAUD Wave Analysis 25 April 2024
April 25, 2024 @ 20:09 +03:00

EURGBP Wave Analysis 24 April 2024
April 24, 2024 @ 21:42 +03:00

EURJPY Wave Analysis 24 April 2024
April 24, 2024 @ 21:40 +03:00