

Technical analysis
Sugar Wave Analysis – 06 January, 2020
January 06, 2020 @ 14:04 +03:00

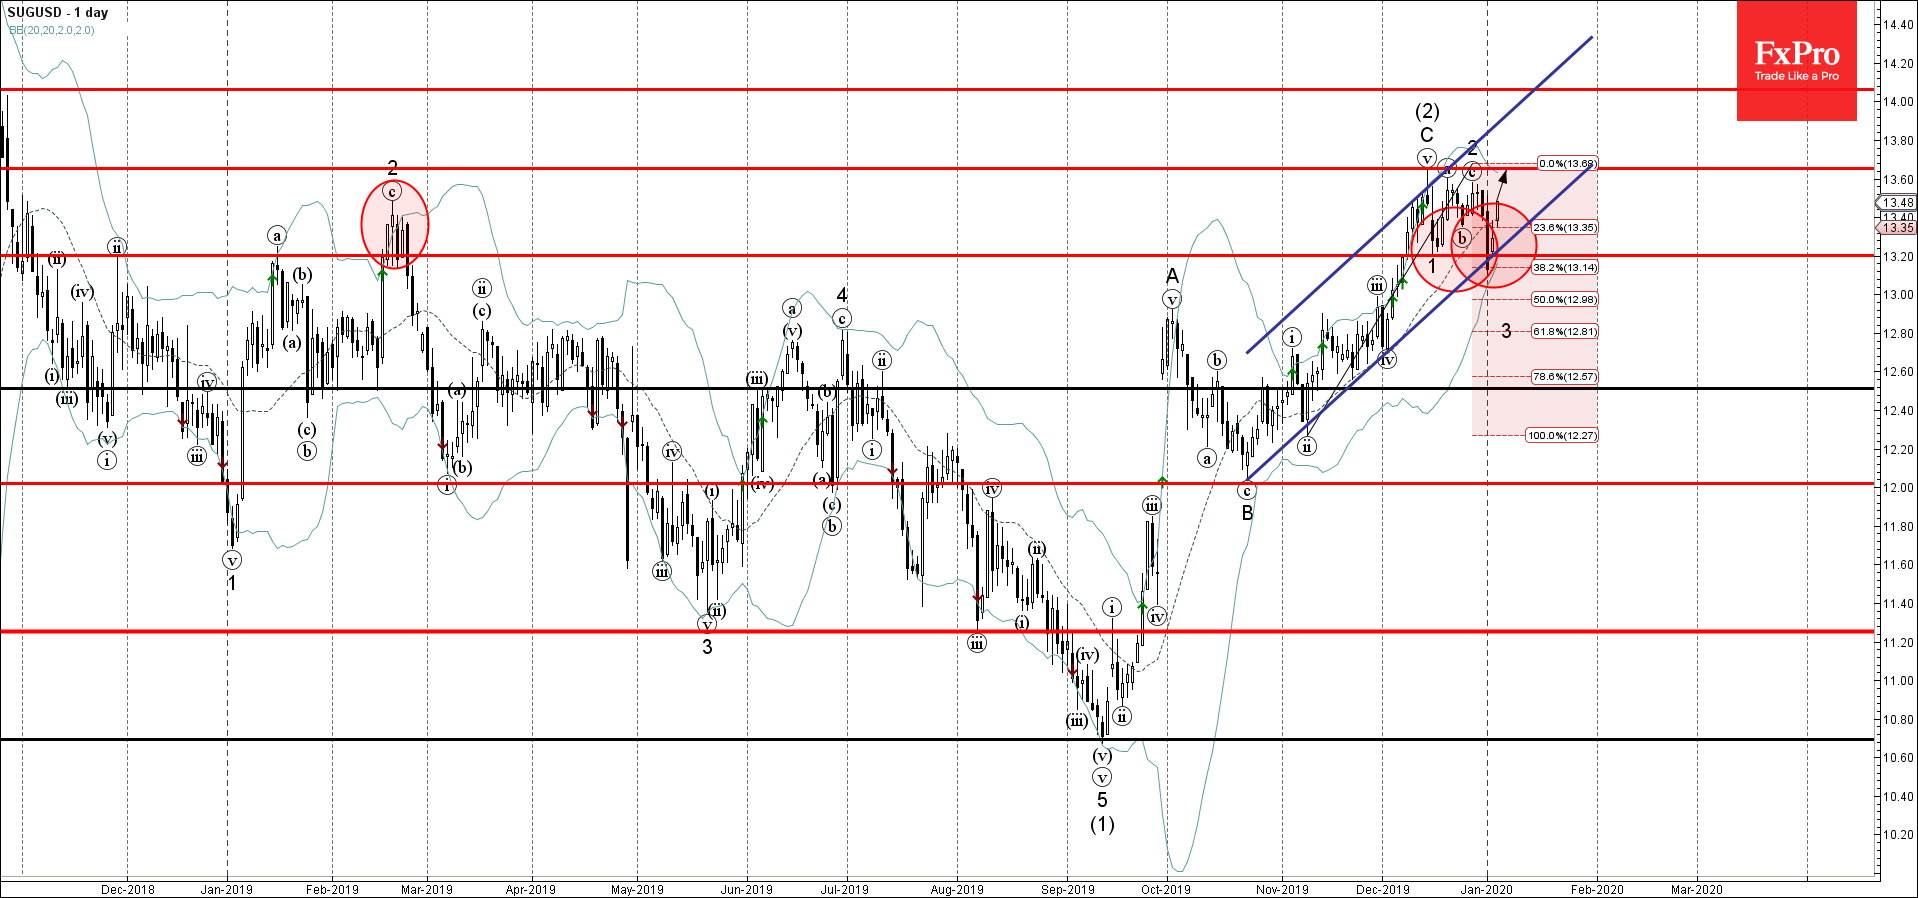
- Sugar reversed from support area
- Likely to rise to 13.60
Sugar recently reversed up from the support area lying between the support level 13.20, support trendline of the daily up channel from October, lower daily Bollinger Band and 38.2% Fibonacci correction of the previous sharp upward impulse from November.
The upward reversal from this support area stopped the previous short-term impulse wave 3.
Sugar is likely to rise toward the next resistance level 13.60 (which reversed the previous impulse wave C in December).
Related Articles

S&P 500 Wave Analysis 15 April 2024
April 16, 2024 @ 00:44 +03:00

EURUSD Wave Analysis 15 April 2024
April 16, 2024 @ 00:44 +03:00

USDCAD Wave Analysis 12 April 2024
April 12, 2024 @ 23:11 +03:00

GBPAUD Wave Analysis 12 April 2024
April 12, 2024 @ 23:10 +03:00