

Technical analysis
Sugar Wave Analysis – 05 October , 2018
October 05, 2018 @ 16:22 +03:00
- Sugar broke resistance area
- Further gains are likely
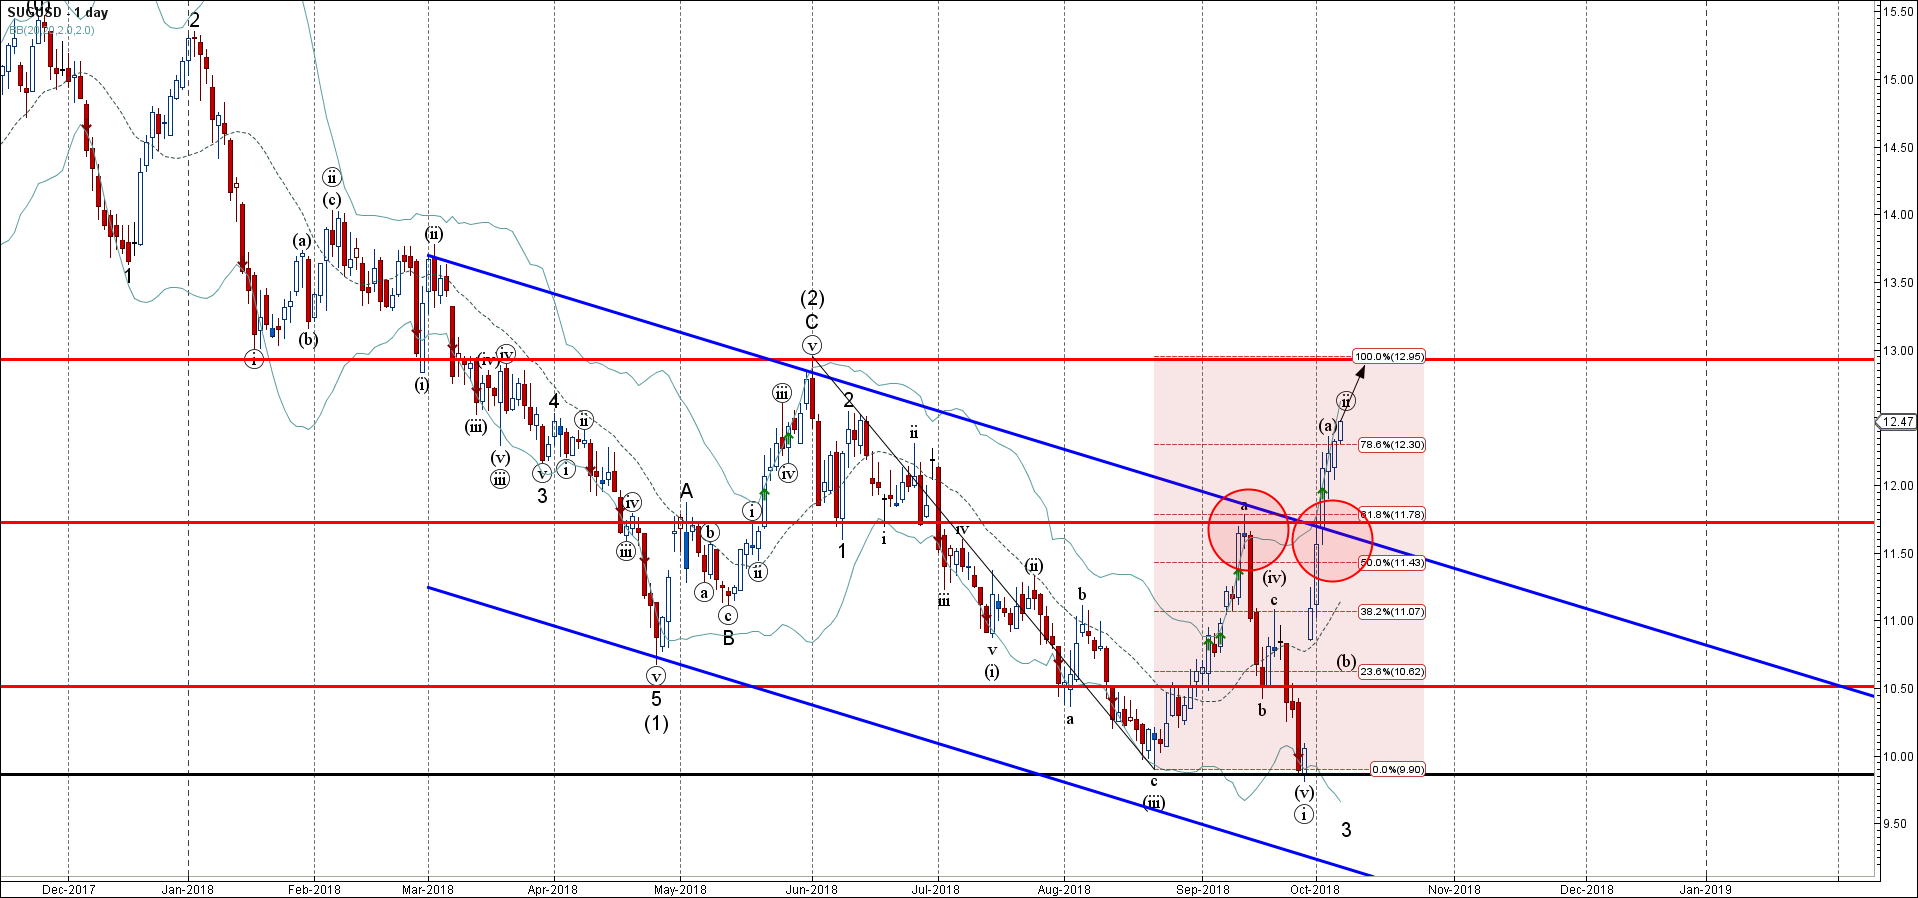
Sugar has been rising sharply in the last few days after the earlier breakout the resistance area lying between the resistance level 11.70 (monthly high from September) and the resistance trendline of the daily down channel from February.
The breakout of this resistance area accelerated the active short-term corrective wave (ii) – which belongs to the extended impulse wave (3) from May.
Sugar is expected to rise further and re-test the next resistance level 12.90 (multi-month high low from June).
Related Articles

GBPCAD Wave Analysis 25 April 2024
April 25, 2024 @ 20:10 +03:00

GBPAUD Wave Analysis 25 April 2024
April 25, 2024 @ 20:09 +03:00

EURGBP Wave Analysis 24 April 2024
April 24, 2024 @ 21:42 +03:00

EURJPY Wave Analysis 24 April 2024
April 24, 2024 @ 21:40 +03:00