

S&P 500 and US 30 Analysis – July 2, 2018
July 02, 2018 @ 18:41 +03:00

US stock indices are set to open lower today as trade war fears continue to plague market sentiment. It has been reported that the Trump administration is drafting a bill that allows government to raise tariffs without congressional consent which effectively takes the US out of WTO rules. Also, in an interview during the weekend President Trump increased the hostility by saying “The EU is possibly as bad as China, just smaller. It is terrible what they do to us”.
The trade dispute with China will be in focus ahead of the 6 July deadline when the US is set to impose tariffs on $34 billion worth of goods from China. The Chinese stock index (Shanghai Composite) fell to two year lows with the Chinese Yuan continuing to weaken.
Volatility will be further increased this week with the release of the FOMC Meeting Minutes on Thursday followed by the Non-Farm Employment Change data on Friday.
S&P 500 On the 4-hourly chart, rallies in the S&P500 (SPX) index have been capped at 2740 with strong support at 2998 which is the 38.2% retracement from the lows in April. A break of this level could see more downside to 2685 and then the 50% retracement at 2670. A break of 2998 could also activate a possible head and shoulders pattern with a measured target to 2605. An upside break of 2715 is needed for the index to again test 2740.
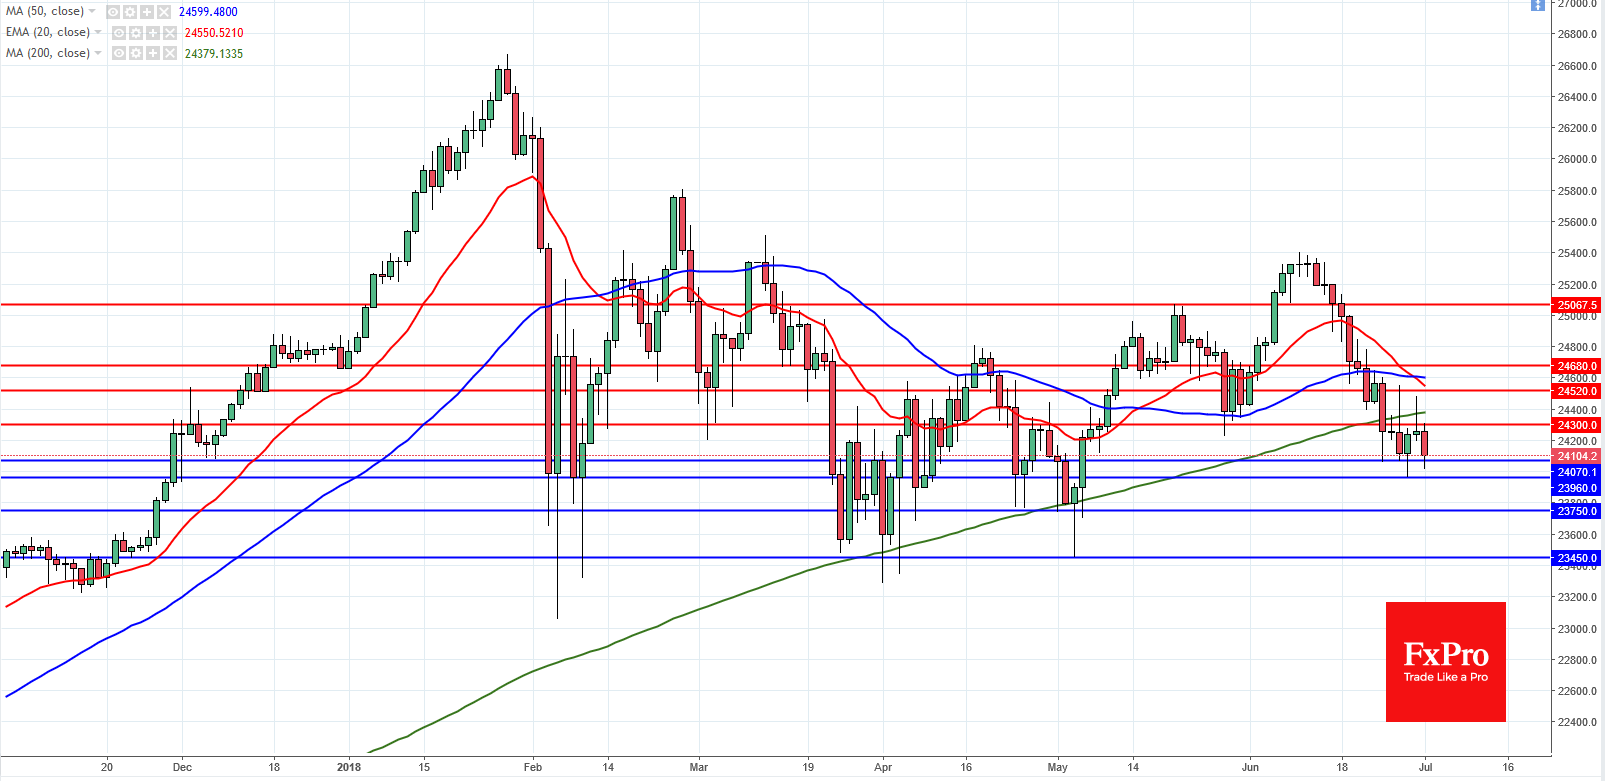
US30 In the daily timeframe, the US30 index has traded under the 200MA for a few days but found support on the weekly 50MA at 24070. The last time this index traded below the weekly 50MA was in 2016. If the 24070 level breaks, the US30 could continue lower with to supports at 23960 and 23750 before again testing the lows around 23450 from the first quarter of the year. A reversal and break of 24300 is needed for a change of trend with upside resistance at 24520.

April 18, 2024 @ 23:09 +03:00

April 18, 2024 @ 23:08 +03:00

April 17, 2024 @ 22:40 +03:00

April 17, 2024 @ 22:38 +03:00