

S&P 500 and Nasdaq 100 Analysis
July 09, 2018 @ 16:30 +03:00
A “Goldilocks” US jobs report on Friday created positive sentiment and boosted US equity indices. The jobs report showed solid growth with little underlying inflation pressures and so the market is not expecting faster rate hikes from the Federal Reserve. Moreover, the US stock market investors appeared to show little concern about the developing trade war between the US and China as the indices continued to rally while the latest round of tariffs came into force on Friday. The positive sentiment continues today as there were no further headlines over the weekend with regards to the trade war. Attention will now turn to the upcoming earning season with JPMorgan and Citigroup among the largest companies due to announce results this week.
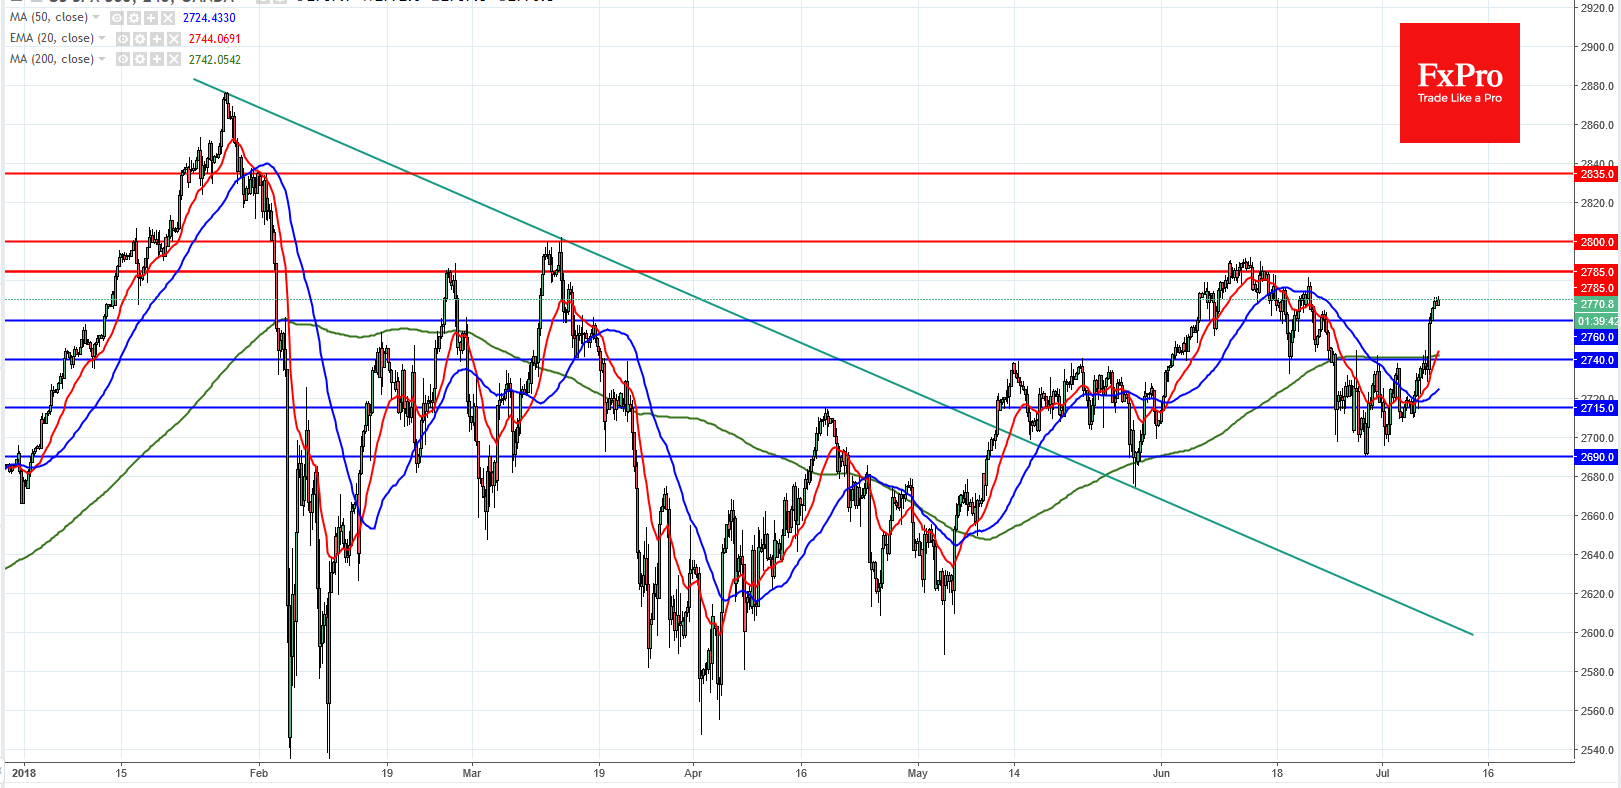
S&P 500 On the 4-hourly chart, the S&P500 (SPX) has broken out to the upside above 2760 negating a possible head and shoulders pattern. The index is likely to continue to the upside and once again find resistance in the 2785-2800 area. A break above 2800 is needed to open the door for a move to 2835 and then new all time highs. Any reversal will find near term support at 2760 and then 2740.
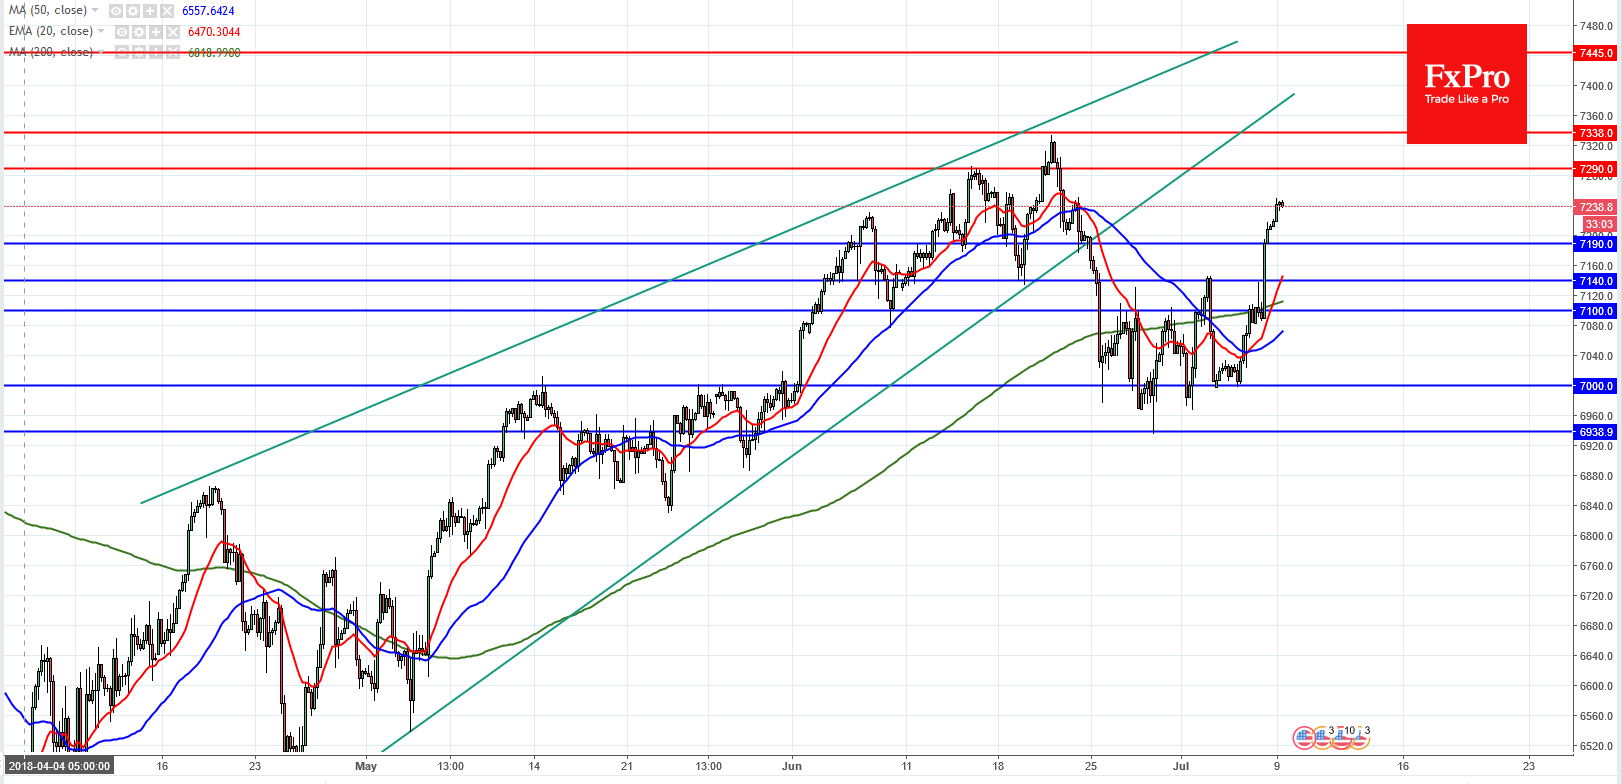
Nasdaq 100 On the 4-hourly chart, the Nasdaq 100 (NDX) bounced off strong support at 7000 and has now broken to the upside above 7190. While above this level, the index is likely to continue towards resistance at 7290 before attempting new all time highs and the 127.2% Fibonacci extension at 7445. On the flip-side, a break of 7190 will change the immediate outlook with support at 7140 and then 7100.

April 19, 2024 @ 22:12 +03:00

April 19, 2024 @ 22:11 +03:00

April 18, 2024 @ 23:09 +03:00

April 18, 2024 @ 23:08 +03:00