

S&P 500 Analysis
July 06, 2018 @ 13:43 +03:00
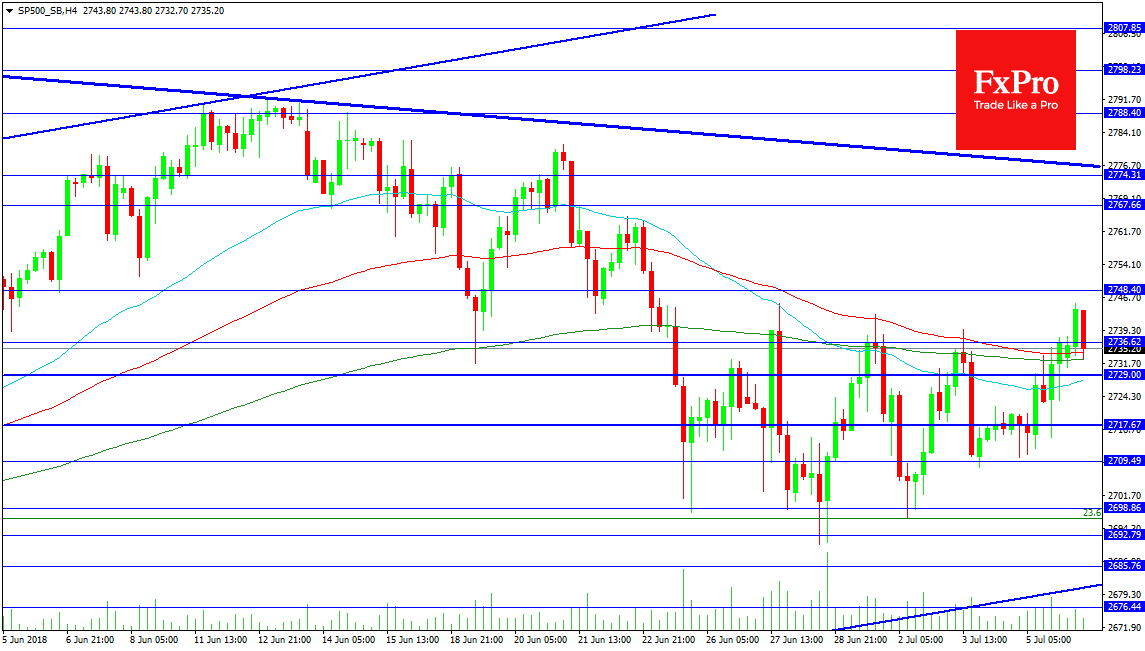
The US 500 Index has moved higher overnight but has now retraced some of this move on the run into Nonfarm Payrolls data. The US/China Trade Tariffs went into place overnight with minimal market reaction. The market is awaiting confirmed reports on the tariff process with one eye on economic data. The price has consolidated in a range between 2745.00 and 2690.00 and NFP data can see this range breeched and widened. Resistance can be seen at 2767.60 followed by 2274.30 and the falling trend line just above at 2776.70. A break higher would need to clear 2792.00 and then test 2800.00/2802.50.
Support can be seen at the 100 and 200 period MA on the 4 hour chart, with the latter supporting the current candle at 2732.66. However these points are very close to the current price and can be ignored once NFP is released. Also quite close is the 2729.00 level and the 50 MA at 2727.80. Below is the 2717.67 level and 2709.49 below which buyers have entered the market. The 2700.00 round number has been less useful that the 2698.80 level in recent times and this can be a point of interest today. A s mentioned earlier a loss of 2690.00 could see a deeper bearish reaction develop leading to a test of trend line support at 2681.00.

April 25, 2024 @ 20:10 +03:00

April 25, 2024 @ 20:09 +03:00

April 24, 2024 @ 21:42 +03:00

April 24, 2024 @ 21:40 +03:00