

Technical analysis
Soy Wave Analysis – 14 January, 2019
January 14, 2019 @ 16:05 +03:00
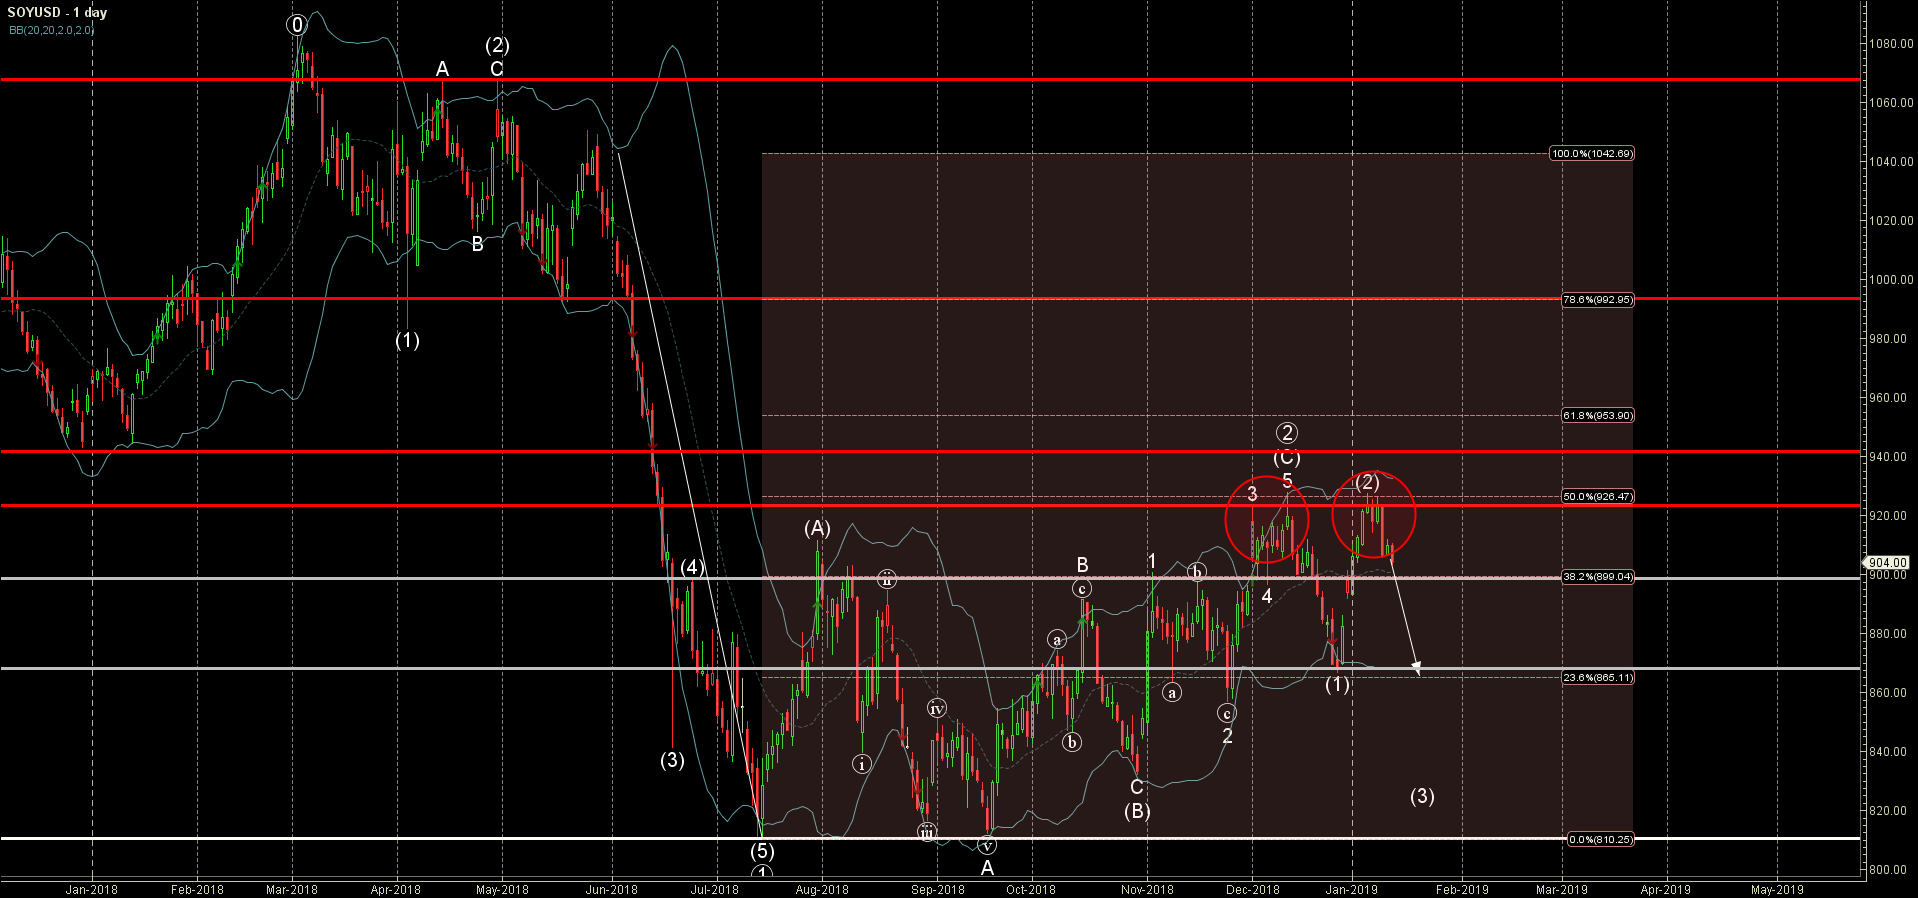
- Soy reversed from resistance area
- Further losses are likely
Soy recently reversed down from the resistance area lying between the strong resistance level 920.00 (which also reversed the price twice in December), upper daily Bollinger Band and the 50% Fibonacci correction of the previous downward impulse from May.
The downward reversal from this resistance area completed the previous medium-term ABC correction (2) from last month.
Soy is expected to fall further and re-test the next round support level 900.00 – the breakout of which can lead to further losses toward 870.00 (low of the previous impulse (1)).
Related Articles

EURGBP Wave Analysis 24 April 2024
April 24, 2024 @ 21:42 +03:00

EURJPY Wave Analysis 24 April 2024
April 24, 2024 @ 21:40 +03:00

WTI crude oil Wave Analysis 23 April 2024
April 23, 2024 @ 22:47 +03:00

USDCAD Wave Analysis 23 April 2024
April 23, 2024 @ 22:46 +03:00