

Technical analysis
Soy Wave Analysis – 13 March, 2020
March 13, 2020 @ 15:27 +03:00

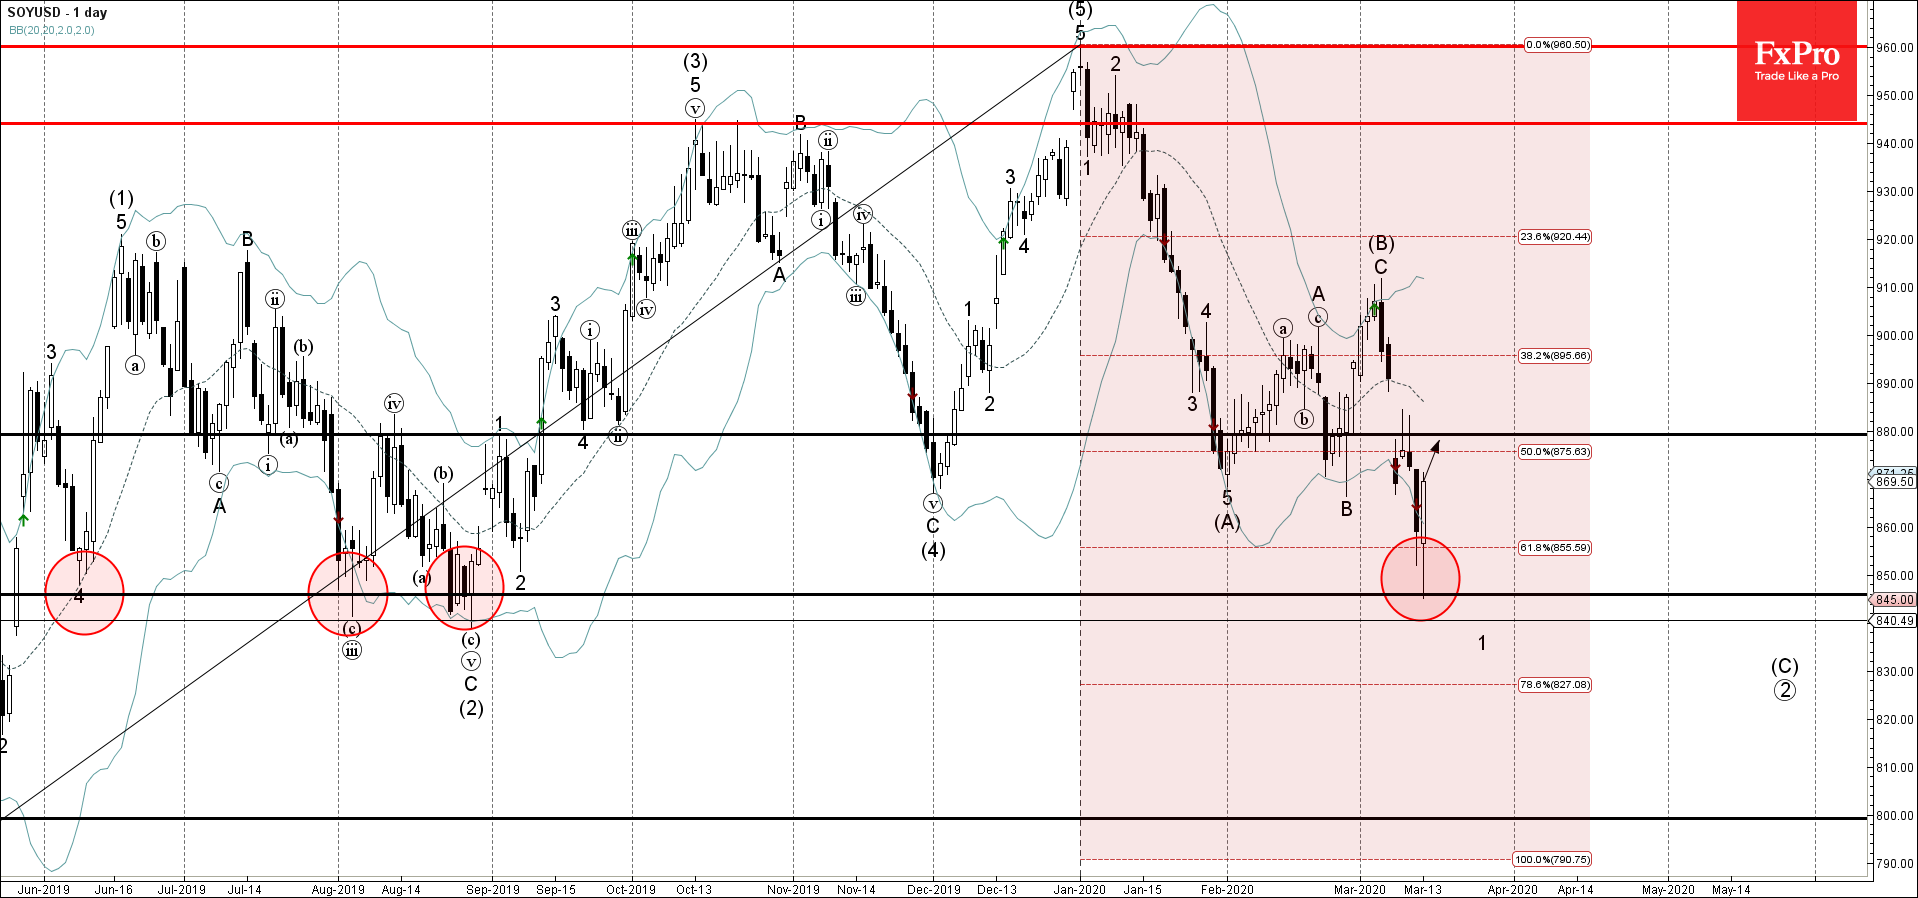
- Soy reversed from support area
- Likely to rise to 880.00
Soy recently reversed up from the support area lying between the key multi-month support level 845.00 (which has been reversing the price from June of 2019), lower daily Bollinger Band and the 61.8% Fibonacci correction of the previous upward impulse sequence from last year.
The upward reversal from this support area stopped the previous impulse waves 1 and (C).
Soy is likely to rise further toward the next round resistance level 880.00 (which formed two earlier daily Shooting Stars).
Related Articles

WTI crude oil Wave Analysis 23 April 2024
April 23, 2024 @ 22:47 +03:00

USDCAD Wave Analysis 23 April 2024
April 23, 2024 @ 22:46 +03:00

Intel Wave Analysis 19 April 2024
April 19, 2024 @ 22:12 +03:00

GBPUSD Wave Analysis 19 April 2024
April 19, 2024 @ 22:11 +03:00