

Technical analysis
NZDUSD Wave Analysis 29 October, 2020
October 29, 2020 @ 17:37 +03:00

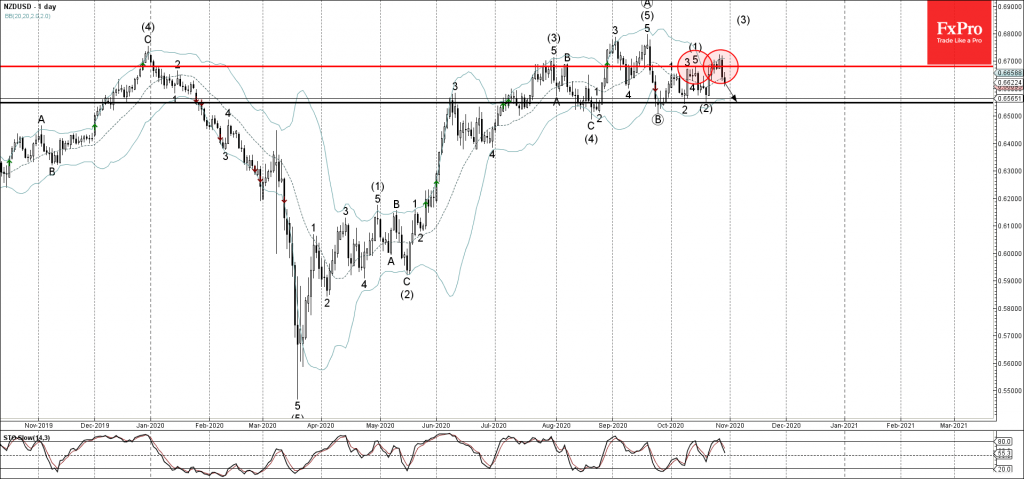
• NZDUSD reversed from resistance area
• Likely to fall to 0.6550
NZDUSD recently reversed down from the resistance area lying between the resistance level 0.6680 (which stopped the previous impulse wave (1) earlier this month) and the upper daily Bollinger Band.
The downward reversal from this resistance area created the daily Japanese candlesticks reversal pattern Bearish Engulfing.
NZDUSD is likely to fall further toward the next support level 0.6550 (low of the previous waves 2 and (2) from the start of October).
Related Articles

Intel Wave Analysis 19 April 2024
April 19, 2024 @ 22:12 +03:00

GBPUSD Wave Analysis 19 April 2024
April 19, 2024 @ 22:11 +03:00

EURJPY Wave Analysis 18 April 2024
April 18, 2024 @ 23:09 +03:00

EURUSD Wave Analysis 18 April 2024
April 18, 2024 @ 23:08 +03:00