

Technical analysis
NZDUSD Wave Analysis 21 September, 2020
September 21, 2020 @ 17:11 +03:00

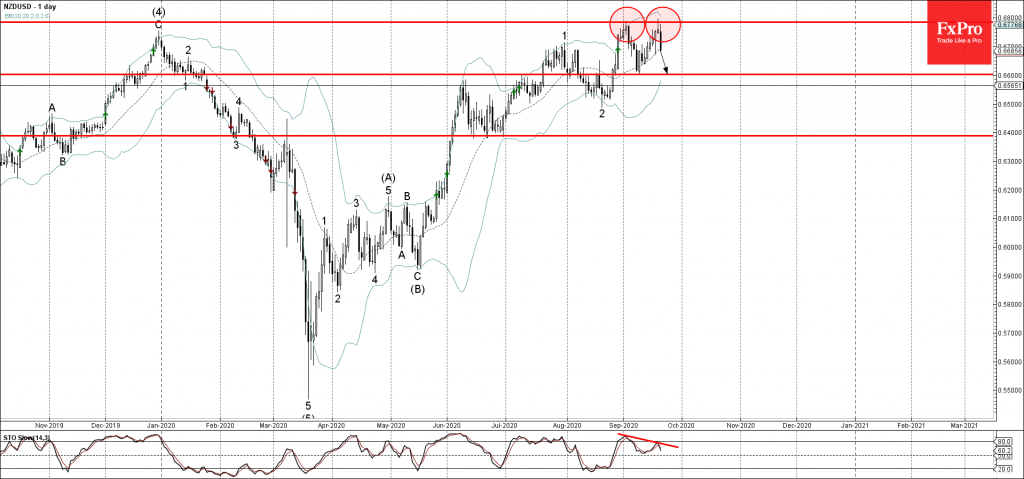
• NZDUSD reversed from resistance area
• Likely to fall to 0.6600
NZDUSD recently reversed down from the resistance area lying between the resistance level 0.6785 (which also stopped the pair at the start of September) and the upper daily Bollinger Band.
The downward reversal from this resistance area created the daily Japanese candlesticks reversal pattern Shooting Star.
Given the bearish divergence on the daily Stochastic indicator – NZDUSD is likely to fall further toward the next support level 0.6600 (low of the previous Piercing Line candlesticks pattern).
Related Articles

GBPCAD Wave Analysis 25 April 2024
April 25, 2024 @ 20:10 +03:00

GBPAUD Wave Analysis 25 April 2024
April 25, 2024 @ 20:09 +03:00

EURGBP Wave Analysis 24 April 2024
April 24, 2024 @ 21:42 +03:00

EURJPY Wave Analysis 24 April 2024
April 24, 2024 @ 21:40 +03:00