

Technical analysis
NZDUSD Wave Analysis – 15 April, 2020
April 15, 2020 @ 17:30 +03:00

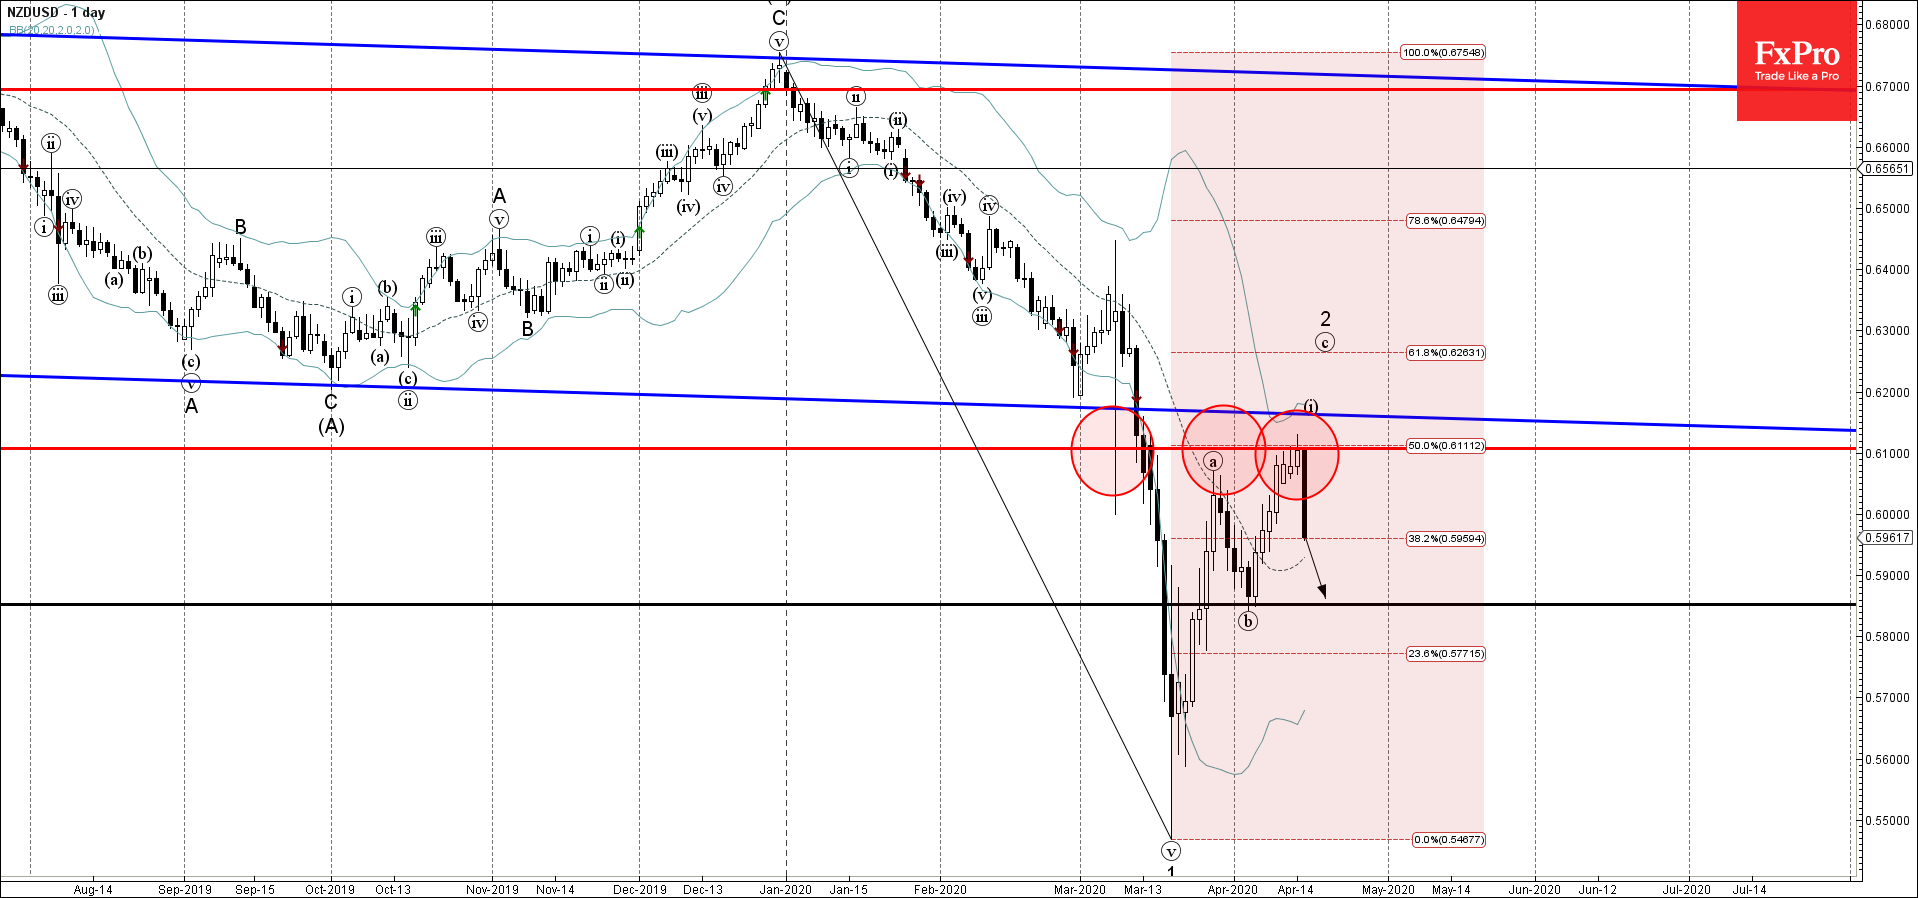
- NZDUSD reversed from resistance area
- Likely to fall to 0.5850
NZDUSD recently reversed down from the resistance area lying between the resistance level 0.6100, upper daily Bollinger Band and the 50% Fibonacci correction of the previous downward impulse from January.
The downward reversal from this resistance area stopped the previous short-term ABC correction 2 from the middle of March.
Given the clear multi-year downtrend that can be seen on the daily and the weekly charts – NZDUSD is likely to fall further toward the next support level 0.5850 (low of the previous wave (b)).
Related Articles

Intel Wave Analysis 19 April 2024
April 19, 2024 @ 22:12 +03:00

GBPUSD Wave Analysis 19 April 2024
April 19, 2024 @ 22:11 +03:00

EURJPY Wave Analysis 18 April 2024
April 18, 2024 @ 23:09 +03:00

EURUSD Wave Analysis 18 April 2024
April 18, 2024 @ 23:08 +03:00